ديموغرافيا سريلانكا
| ديموغرافيا سريلانكا | |
|---|---|
 الهرم السكاني لسريلانكا عام 2020. | |
| السكان | 21.763.170 (تعداد 2024)[1] |
| الكثافة | 332/كم2 (2018) |
| معدل النمو | 0.61% (2022) |
| معدل المواليد | 11.2 مولد/1.,000 شخص (تقديرات 2023) |
| معدل الوفيات | 8.2 متوفى /1.000 شخص(تقديرات 2023) |
| العمر المتوقع | 75.94 سنة (تقديرات 2012) |
| • الذكور | 72.43 سنة (تقديرات 2012) |
| • الإناث | 79.59 سنة (تقديرات 2012) |
| معدل الخصوبة | 1.97 مولد/امرأة (تقديرات 2023)[2] |
| معدل وفيات الأطفال | 9.47 مولود متوفى/1.000 مولود حي (تقديرات 2012) |
| التركيبة العمرية | |
| 0–14 سنة | 20.7% (2024)[3] |
| 15–64 سنة | 66.7% (2024)[3] |
| 65 وأكثر | 12.6% (2024)[3] |
| النسبة بين الجنسين | |
| الإجمالي | 0.93 ذكور/إناث (2018)[3] |
| عند الميلاد | 1.02 ذكور/إناث (2018)[3] |
| تحت 15 | 1.02 ذكور/إناث (2018)[3] |
| 15–64 سنة | 0.93 ذكور/إناث (2018)[3] |
| 65 وأكثر | 0.76 ذكور/إناث (2018)[3] |
| الجنسية | |
| الجنسية | الاسم: سريلانكي الصفة: سريلانكي |
| الأغلبية العرقية | السنهال (74.1%) (تعداد 2024) |
| الأقلية العرقية |
|
| اللغة | |
| الرسمية | السنهالية، التاميلية |
| المنطوقة | الإنگليزية |

ديموغرافيا سريلانكا، هي مقالة تتناول الكثافة السكانية، الجماعات العرقية، مستوى التعليم، الصحة السكانية، الوضع الاقتصادي، الانتماءات الدينية، وجوانب أخرى لسكان سريلانكا.
سريلانكا جزيرة في المحيط الهندي، وتُعرف أيضاً باسم سيلان، ولها أسماء أخرى عديدة. تبلغ مساحتها تقريباً مساحة أيرلندا. تقع على بُعد حوالي 28 كم قبالة الساحل الجنوبي الشرقي للهند، ويبلغ عدد سكانها حوالي 22 مليون نسمة. تتركز الكثافة السكانية في الجنوب الغربي حيث تقع كولومبو، الميناء الرئيسي والمركز الصناعي للبلاد. يبلغ معدل النمو السكاني الصافي حوالي 0.7%. تتميز سريلانكا بتنوعها العرقي واللغوي والديني.
نظرة عامة
| السنة | تعداد | ±% p.a. |
|---|---|---|
| 1800[9] | 1٬200٬000 | — |
| 1871 | 2.400.380 | — |
| 1881 | 2.759.738 | — |
| 1891 | 3.007.789 | — |
| 1901 | 3.565.954 | — |
| 1911 | 4.106.350 | — |
| 1921 | 4.498.605 | — |
| 1931 | 5.306.871 | — |
| 1946 | 6.657.339 | — |
| 1953 | 8.097.895 | — |
| 1963 | 10.582.064 | — |
| 1971 | 12.689.897 | — |
| 1981 | 14.846.750 | — |
| 1990 | 17.325.773 | — |
| 2000 | 18.777.601 | — |
| 2012 | 20.359.439 | — |
| 2024 | 21.763.170 | — |
| Source: [4][5][6][7][8] | ||
بحسب تعداد عام 2012، بلغ عدد سكان سريلانكا 20.359.439 نسمة، مما يعطي كثافة سكانية قدرها 325 نسمة/كم².[8] ازداد عدد السكان بمقدار 5.512.689 نسمة (37.1%) منذ تعداد عام 1981 (آخر تعداد سكاني كامل)، أي ما يعادل معدل نمو سنوي قدره 1.1%.[8] 3.704.470 (18.2%) يعيشون في المناطق الحضرية - وهي المناطق التي تحكمها المجالس البلدية والحضرية.[10]
بلغ عدد السكان الذين تقل أعمارهم عن 14 عاماً 5.131.666 نسمة (25.2%)، بينما بلغ عدد السكان الذين تبلغ أعمارهم 60 عاماً أو أكثر 2.525.573 نسمة (12.4%)، مما يجعل عدد السكان في سن العمل (15-59 عاماً) يبلغ 12.702.700 نسمة.[11] يبلغ معدل الإعالة 60.2%.[8] The mean age was 32 years and the median age was 31 years.[8] The sex ratio was 94 males per 100 females.[8] The fertility rate for married females aged 15 or over was 2.65 live births.[12] There were 5,264,282 households, of which 3,986,236 (75.7%) were headed by males and 1,278,046 (24.3%) were headed by females.[8]
Of the 15,227,773 aged 15 or over, 10,322,105 (67.8%) were married, 3,927,602 (25.8%) were never married, 792,947 (5.2%) were widowed and 185,119 (1.2%) were divorced or separated.[13]
Of those aged 15 or over, 7,857,370 (51.6%) were economically active, 4,199,558 (27.6%) did housework, 1,431,105 (9.4%) were students, 914,934 (6.0%) were unable to work and 346,084 (2.3%) were pensioners.[14] 521,938 (6.6%) of the economically active were unemployed.[8] 604,540 Sri Lankans were living aboard for more than six months but were intending to return to Sri Lanka, mostly in the Gulf states (373,050 61.7%).[15]
The overall literacy rate for those aged 10 and over was 95.7% but amongst those living in the estate sector it was only 86.1%.[16] Of the 18,615,577 aged 5 or over, 499,563 (2.7%) had received a higher education qualification, 2,293,841 (12.3%) had passed G.C.E. A/L, 3,159,402 (17.0%) had passed G.C.E. O/L and 700,419 (3.8%) had no formal schooling.[17] The remaining 11,962,352 (64.3%) had left school with no qualifications or were currently at school.[17]
Sri Lanka's population is aging faster than any other nation in South Asia and has the fifth highest rapidly growing population of older people in Asia after China, Thailand, South Korea and Japan.[18][19][20] In 2015, Sri Lanka's population aged over 60 was 13.9%, by 2030 this will increase to 21% and by 2050 this number will reach 27.4%.[19][20] Sri Lanka's rapidly growing older population has ignited concerns of the socio-economic challenges that the country will face because of this.[21]
الفئات العمرية
| الفئة العمرية | الذكور | الإناث | الإجمالي | % |
|---|---|---|---|---|
| الإجمالي | 9 856 634 | 10 502 805 | 20 359 439 | 100 |
| 0–4 | 879 223 | 864 639 | 1 743 862 | 8.57 |
| 5–9 | 882 108 | 865 644 | 1 747 752 | 8.58 |
| 10–14 | 829 069 | 810 983 | 1 640 052 | 8.06 |
| 15–19 | 819 927 | 824 322 | 1 644 249 | 8.08 |
| 20–24 | 742 316 | 790 567 | 1 532 883 | 7.53 |
| 25–29 | 743 510 | 809 338 | 1 552 848 | 7.63 |
| 30–34 | 796 866 | 842 549 | 1 639 415 | 8.05 |
| 35–39 | 686 037 | 723 040 | 1 409 077 | 6.92 |
| 40–44 | 661 623 | 697 586 | 1 359 209 | 6.68 |
| 45–49 | 618 140 | 667 690 | 1 285 830 | 6.32 |
| 50–54 | 581 293 | 638 167 | 1 219 460 | 5.99 |
| 55–59 | 500 871 | 563 358 | 1 064 229 | 5.23 |
| 60–64 | 425 428 | 492 482 | 917 910 | 4.51 |
| 65-69 | 283 764 | 349 525 | 633 289 | 3.11 |
| 70-74 | 181 846 | 230 568 | 412 414 | 2.03 |
| 75-79 | 116 389 | 166 797 | 283 186 | 1.39 |
| 80-84 | 64 250 | 95 129 | 159 379 | 0.78 |
| 85-89 | 28 293 | 45 148 | 73 441 | 0.36 |
| 90-94 | 9 293 | 14 965 | 24 258 | 0.12 |
| 95+ | 6 388 | 10 308 | 16 696 | 0.08 |
| Age group | Male | Female | Total | Percent |
| 0–14 | 2 590 400 | 2 541 266 | 5 131 666 | 25.21 |
| 15–64 | 6 576 011 | 7 049 099 | 13 625 110 | 66.92 |
| 65+ | 690 223 | 912 440 | 1 602 663 | 7.87 |
الإحصاءات الحيوية
تقديرات الأمم المتحدة
| الفترة [23] | المواليد الأحياء سنوياً | الوفيات سنوياً | التغير الطبيعي سنويأً | CBR1 | CDR1 | NC1 | TFR1 | IMR1 |
|---|---|---|---|---|---|---|---|---|
| 1950–1955 | 322.000 | 171.000 | 151.000 | 37.4 | 19.8 | 17.5 | 5.80 | 103.9 |
| 1955–1960 | 367.000 | 143.000 | 223.000 | 38.6 | 15.1 | 23.5 | 5.80 | 86.7 |
| 1960–1965 | 377.000 | 128.000 | 248.000 | 35.5 | 12.1 | 23.4 | 5.20 | 77.5 |
| 1965–1970 | 391.000 | 116.000 | 276.000 | 32.9 | 9.7 | 23.2 | 4.70 | 69.3 |
| 1970–1975 | 383.000 | 103.000 | 280.000 | 29.1 | 7.8 | 21.3 | 4.00 | 55.4 |
| 1975–1980 | 401.000 | 99.000 | 302.000 | 27.8 | 6.9 | 20.9 | 3.61 | 38.8 |
| 1980–1985 | 401.000 | 96.000 | 305.000 | 25.6 | 6.1 | 19.5 | 3.19 | 30.3 |
| 1985–1990 | 362.000 | 110.000 | 253.000 | 21.6 | 6.5 | 15.1 | 2.64 | 24.1 |
| 1990–1995 | 349.000 | 119.000 | 230.000 | 19.6 | 6.7 | 12.9 | 2.39 | 22.1 |
| 1995–2000 | 329.000 | 146.000 | 183.000 | 17.8 | 7.9 | 9.9 | 2.16 | 18.9 |
| 2000–2005 | 360.000 | 121.000 | 239.000 | 18.7 | 6.3 | 12.4 | 2.27 | 15.9 |
| 2005–2010 | 386.000 | 132.000 | 253.000 | 19.0 | 6.5 | 12.5 | 2.36 | 12.4 |
| 2010–2015 | 16.4 | 6.6 | 9.8 | 2.11 | ||||
| 2015–2020 | 14.9 | 7.1 | 7.8 | 2.03 | ||||
| 1 CBR = معدل المواليد الصافي (لكل 1000)؛ CDR = معدل الوفيات الصافي (لكل 1000)؛ NC = التغير الطبيعي (لكل 1000)؛ TFR = معدل الخصوبة الإجمالي (number of children per woman); IMR = معدل وفيات الرضع لكل 1000 مولود | ||||||||
المواليد والوفيات المسجلون
| السنة [24][25] | عدد السكان | المواليد الأحياء | الوفيات | الزيادة الطبيعية | معدل المواليد الصافي | معدل الوفيات الصافي | معدل الزيادة الطبيعية | معدل الهجرة الصافي | TFR |
|---|---|---|---|---|---|---|---|---|---|
| 1948 | 287.695 | 93.711 | 193.984 | 39.7 | 13.0 | 26.7 | |||
| 1949 | 291.191 | 91.889 | 199.302 | 39.1 | 12.4 | 26.7 | |||
| 1950 | 304.635 | 95.142 | 209.493 | 39.7 | 12.6 | 27.1 | |||
| 1951 | 313.662 | 100.072 | 213.590 | 39.8 | 12.9 | 26.9 | |||
| 1952 | 313.532 | 95.298 | 218.234 | 38.8 | 12.0 | 26.8 | |||
| 1953 | 321.217 | 89.003 | 232.214 | 38.7 | 10.9 | 27.8 | |||
| 1954 | 303.894 | 86.794 | 217.100 | 35.7 | 10.4 | 25.3 | |||
| 1955 | 325.538 | 94.368 | 231.170 | 37.3 | 11.0 | 26.3 | |||
| 1956 | 325.067 | 87.561 | 237.506 | 36.4 | 9.8 | 26.6 | |||
| 1957 | 334.135 | 92.759 | 241.376 | 36.5 | 10.1 | 26.4 | |||
| 1958 | 335.690 | 90.815 | 244.875 | 35.8 | 9.7 | 26.1 | |||
| 1959 | 356.336 | 87.971 | 268.365 | 37.0 | 9.1 | 27.9 | |||
| 1960 | 361.702 | 84.918 | 276.784 | 36.6 | 8.6 | 28.0 | |||
| 1961 | 363.677 | 81.653 | 282.024 | 35.8 | 8.0 | 27.8 | |||
| 1962 | 370.762 | 88.928 | 281.834 | 35.5 | 8.5 | 27.0 | |||
| 1963 | 365.842 | 91.673 | 274.169 | 34.1 | 8.5 | 25.6 | |||
| 1964 | 361.577 | 95.618 | 265.959 | 33.2 | 8.8 | 24.4 | |||
| 1965 | 369.437 | 91.728 | 277.709 | 33.1 | 8.8 | 24.3 | |||
| 1966 | 369.153 | 94.419 | 274.734 | 32.3 | 8.3 | 24.0 | |||
| 1967 | 369.531 | 87.877 | 281.654 | 31.9 | 7.5 | 24.4 | |||
| 1968 | 384.178 | 94.903 | 289.275 | 32.0 | 7.9 | 24.1 | |||
| 1969 | 372.774 | 102.356 | 270.418 | 30.4 | 8.1 | 22.3 | |||
| 1970 | 367.901 | 94.129 | 273.772 | 29.4 | 7.5 | 21.9 | |||
| 1971 | 382.668 | 96.328 | 286.340 | 30.4 | 7.7 | 22.7 | |||
| 1972 | 385.462 | 100.080 | 285.382 | 30.0 | 8.1 | 21.9 | |||
| 1973 | 367.158 | 100.678 | 266.480 | 28.0 | 7.7 | 20.3 | |||
| 1974 | 365.902 | 119.518 | 246.384 | 27.5 | 9.0 | 18.5 | |||
| 1975 | 374.689 | 115.108 | 259.581 | 27.8 | 8.5 | 19.3 | |||
| 1976 | 380.702 | 106.506 | 274.196 | 27.8 | 7.8 | 20.0 | |||
| 1977 | 389.522 | 103.284 | 286.238 | 27.9 | 7.4 | 20.5 | |||
| 1978 | 404.831 | 93.971 | 310.860 | 28.5 | 6.6 | 21.9 | |||
| 1979 | 417.986 | 94.244 | 323.742 | 28.9 | 6.5 | 22.4 | |||
| 1980 | 418.373 | 91.020 | 327.353 | 28.4 | 6.2 | 22.2 | |||
| 1981 | 423.973 | 88.481 | 335.492 | 28.2 | 5.9 | 22.3 | |||
| 1982 | 408.895 | 92.244 | 316.651 | 26.9 | 6.1 | 20.8 | |||
| 1983 | 405.122 | 95.174 | 309.948 | 26.3 | 6.2 | 20.1 | |||
| 1984 | 391.064 | 100.725 | 290.339 | 25.1 | 6.5 | 18.6 | |||
| 1985 | 389.599 | 98.089 | 291.510 | 24.6 | 6.2 | 18.4 | |||
| 1986 | 361.735 | 96.145 | 265.590 | 22.4 | 6.0 | 16.4 | |||
| 1987 | 357.723 | 97.756 | 259.967 | 21.8 | 6.0 | 15.8 | |||
| 1988 | 344.179 | 95.934 | 248.245 | 20.7 | 5.8 | 14.9 | |||
| 1989 | 363.343 | 105.239 | 258.104 | 21.6 | 6.3 | 15.3 | |||
| 1990 | 341.223 | 97.713 | 243.510 | 20.8 | 6.0 | 14.8 | |||
| 1991 | 356.593 | 95.574 | 261.019 | 21.7 | 5.8 | 15.9 | |||
| 1992 | 356.842 | 98.380 | 258.462 | 21.5 | 5.9 | 15.6 | |||
| 1993 | 350.707 | 96.179 | 254.528 | 20.8 | 5.7 | 15.1 | |||
| 1994 | 356.071 | 100.394 | 255.677 | 20.8 | 5.9 | 14.9 | |||
| 1995 | 343.224 | 104.707 | 238.517 | 19.9 | 6.0 | 13.9 | |||
| 1996 | 340.649 | 122.161 | 218.488 | 19.5 | 7.0 | 12.5 | |||
| 1997 | 333.219 | 114.591 | 218.628 | 18.8 | 6.4 | 12.4 | |||
| 1998 | 322.672 | 112.653 | 210.019 | 18.2 | 6.2 | 12.0 | |||
| 1999 | 328.725 | 115.330 | 213.395 | 18.1 | 6.3 | 11.8 | |||
| 2000 | 347.749 | 116.200 | 231.549 | 18.4 | 6.1 | 12.3 | |||
| 2001 | 358.583 | 112.858 | 245.725 | 18.9 | 5.9 | 13.0 | |||
| 2002 | 367.709 | 111.863 | 255.846 | 19.1 | 5.8 | 13.3 | |||
| 2003 | 370.643 | 115.495 | 255.148 | 18.9 | 5.9 | 13.0 | |||
| 2004 | 364.711 | 114.915 | 249.796 | 18.5 | 5.8 | 12.7 | |||
| 2005 | 370.731 | 132.097 | 238.634 | 18.1 | 6.5 | 11.6 | |||
| 2006 | 373.538 | 117.467 | 256.071 | 18.8 | 5.9 | 12.9 | |||
| 2007 | 386.573 | 118.992 | 267.581 | 19.2 | 5.9 | 13.3 | |||
| 2008 | 373.575 | 123.814 | 249.761 | 18.4 | 6.1 | 12.3 | |||
| 2009 | 368.304 | 127.776 | 240.528 | 18.0 | 6.2 | 11.8 | |||
| 2010 | 364.565 | 128.603 | 235.962 | 17.7 | 6.2 | 11.4 | |||
| 2011 | 363.415 | 123.261 | 240.154 | 17.4 | 5.9 | 11.5 | |||
| 2012 | 20.425.000 | 355.900 | 122.063 | 233,837 | 17.5 | 6.0 | 11.5 | 2.252 | |
| 2013 | 20.585.000 | 365.792 | 127.124 | 238.668 | 17.9 | 6.2 | 11.7 | -3.9 | 2.264 |
| 2014 | 20.771.000 | 349.715 | 127.758 | 221.957 | 16.8 | 6.2 | 10.6 | -1.6 | 2.148 |
| 2015 | 20.970.000 | 334.821 | 131.634 | 203.187 | 16.0 | 6.3 | 9.7 | -0.1 | 2.046 |
| 2016 | 21.203.000 | 331.073 | 130.765 | 200.308 | 15.6 | 6.2 | 9.4 | 1.7 | 1.985 |
| 2017 | 21,444.000 | 326.052 | 139.822 | 186.230 | 15.2 | 6.5 | 8.7 | 2.7 | 1.944 |
| 2018 | 21.670.000 | 328.112 | 139.498 | 188.614 | 15.1 | 6.4 | 8.7 | 1.8 | 1.937 |
| 2019 | 21.803.000 | 319.010 | 146.053 | 172.957 | 14.6 | 6.7 | 7.9 | -1.8 | 1.871 |
| 2020 | 21.919.000 | 301.706 | 132.431 | 169.275 | 13.8 | 6.0 | 7.8 | -2.5 | 1.756 |
| 2021 | 22.156.000 | 284.848 | 163.936 | 120.912 | 12.9 | 7.4 | 5.5 | 5.3 | 1.7(e) |
| 2022 | 22.181.000 | 275.321 | 179.792 | 95.529 | 12.4 | 8.1 | 4.3 | -3.2 | 1.65(e) |
| 2023 | 22.037.000 | 247.900 | 181.239 | 66.661 | 11.2 | 8.2 | 3.0 | -9.5 | 1.49(e) |
| 2024 | 21.763.170 | 220.761 | 171.194 | 49.567 | 10.1 | 7.8 | 2.3 | -14.9 | 1.37(e) |
الإحصاءات الحيوية الحالية
| الفترة | المواليد الأحياء | الوفيات | الزيادة الطبيعية |
|---|---|---|---|
| يناير - يونيو 2024 | 109.025 | + | |
| يناير - يونيو 2025 | 110.652 | ||
| الفرق | ▲ +1.627 (+1.5%) | ▼ | |
| المصدر:[26] | |||
المسوحات الديموغرافية والصحية
معدل الخصوبة الإجمالي (TFR) (معدل الخصوبة المرغوب) ومعدل المواليد الصافي (CBR):
| السنة [27] | الإجمالي | الحضر | الريف | تقديرات | ||||
|---|---|---|---|---|---|---|---|---|
| CBR | TFR | CBR | TFR | CBR | TFR | CBR | TFR | |
| 1981–1983 | 3.1 | 2.4 | 3.2 | 3.4 | ||||
| 1987 | 2.8 (2.4) | 2.3 (1.9) | 2.9 (2.4) | 3.4 (3.2) | ||||
| 2006–2007 | 18.7 | 2.3 (2.1) | 18.5 | 2.2 (2.0) | 18.6 | 2.3 (2.1) | 20.0 | 2.5 (2.1) |
متوسط العمر المتوقع


| الفترة [28] | متوسط العمر المتوقط بالسنوات |
الفترة | متوسط العمر المتوقع بالسنوات |
|---|---|---|---|
| 1950–1955 | 54.5 | 1985–1990 | 68.9 |
| 1955–1960 | 58.3 | 1990–1995 | 70.0 |
| 1960–1965 | 60.3 | 1995–2000 | 69.1 |
| 1965–1970 | 62.9 | 2000–2005 | 73.2 |
| 1970–1975 | 65.2 | 2005–2010 | 74.1 |
| 1975–1980 | 67.0 | 2010–2015 | 74.6 |
| 1980–1985 | 69.1 |
العرقية

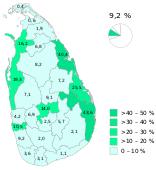
يشكل السنهاليون 74.9% من السكان (بحسب تعداد 2012) ويتركزون في الأجزاء الجنوبية الغربية والوسطى ذات الكثافة السكانية المرتفعة من الجزيرة.[29]
يشكل التاميل السريلانكيون، الذين يعيشون في الغالب في المحافظتين الشمالية والشرقية من الجزيرة، أكبر جماعة أقلية بنسبة 11.1% (بحسب تعداد 2012) من السكان.[29]
يشكل المور، وهم أحفاد التجار العرب والهنود والتاميل السريلانكيين الأصليين، ثالث أكبر جماعة عرقية بنسبة 9.3% من السكان.[29] يتركز هؤلاء المسلمون الناطقون بالتاميلية في الغالب بالمناطق الحضرية في الأجزاء الجنوبية من الجزيرة، مع وجود أعداد كبيرة منهم في المحافظتين الوسطى والشرقية. خلال فترة الاستعمار الپرتغالي، تعرض المور للاضطهاد، وأُجبر الكثير منهم على التراجع إلى المرتفعات الوسطى والساحل الشرقي.[citation needed]
وهناك أيضاً التاميل الهنود الذين يشكلون جماعة عرقية متميزة تضم 4.1% من السكان.[29] جلب البريطانيون التاميل الهنود إلى سريلانكا في القرن التاسع عشر للعمل في مزارع الشاي والمطاط، ولا يزالون يتركزون في منطقة زراعة الشاي بجنوب وسط سريلانكا. واعتُبر التاميل الهنود في سريلانكا "عديمي الجنسية" لأنهم حُرموا من الجنسية السيلانية وجُردوا في الوقت نفسه من الجنسية الهندية، حيث تم ترحيل أكثر من 300.000 تاميلي هندي إلى الهند، بموجب اتفاقية بين سريلانكا والهند عام 1964.[30] بموجب الاتفاقية، منحت الهند الجنسية للباقين، والبالغ عددهم نحو 200.000 شخص يقيمون حالياً في الهند. ويرغب 75.000 آخرون من التاميل الهنود، الذين سبق لهم أو لآبائهم التقدم بطلبات للحصول على الجنسية الهندية، في البقاء في سريلانكا. وقد صرحت الحكومة بأن هؤلاء التاميل لن يُجبروا على العودة إلى الهند، على الرغم من أنهم ليسوا مواطنين سريلانكيين رسمياً. وبحلول التسعينيات، كان معظم التاميل الهنود قد حصلوا على الجنسية السريلانكية، بل إن بعضهم لم يحصل عليها إلا عام 2003.[30][31]
وتشمل الأقليات الأصغر الڤـِدا، وهم السكان الأصليون لسريلانكا؛ الملايو الذين ينحدرون من المستوطنين الأسترونيزيين؛ والبورگر، وهم أحفاد المستعمرين الأوروپيين، وخاصة من الپرتغال، هولندا، والمملكة المتحدة؛ والمهاجرون الصينيون في سريلانكا الذين قدموا إلى الجزيرة في القرنين الثامن عشر والتاسع عشر؛ الكافير، وهم مجموعة صغيرة من السكان ينحدرون من الأفارقة.
| السنة | السنهاليون | التاميل السريلانكيون[أ] | المور السريلانكيون[ب] | التاميل الهنود[أ] | الملايو السريلانكيون | البوروگر/ الأوراسيون |
المور الهنود[ب] | أخرى | العدد الإجمالي | ||||||||
|---|---|---|---|---|---|---|---|---|---|---|---|---|---|---|---|---|---|
| العدد | % | العدد | % | العدد | % | العدد | % | العدد | % | العدد | % | العدد | % | العدد | % | ||
| تعداد 1881 | 1.846.600 | 66٫91% |
687.200 | 24٫90% |
184.500 | 6٫69% |
8.900 | 0٫32% |
17.900 | 0٫65% |
14.500 | 0٫53% |
2.759.700 | ||||
| تعداد 1891 | 2.041.200 | 67٫86% |
723.900 | 24٫07% |
197.200 | 6٫56% |
10.100 | 0٫34% |
21.200 | 0٫70% |
14.200 | 0٫47% |
3.007.800 | ||||
| تعداد 1901 | 2.330.800 | 65٫36% |
951.700 | 26٫69% |
228.000 | 6٫39% |
11.900 | 0٫33% |
23.500 | 0٫66% |
20.000 | 0٫56% |
3.566.000 | ||||
| تعداد 1911 | 2.715.500 | 66٫13% |
528.000 | 12٫86% |
233.900 | 5٫70% |
531.000 | 12٫93% |
13.000 | 0٫32% |
26.700 | 0٫65% |
32.700 | 0٫80% |
25.600 | 0٫62% |
4.106.400 |
| تعداد 1921 | 3.016.200 | 67٫05% |
517.300 | 11٫50% |
251.900 | 5٫60% |
602.700 | 13٫40% |
13.400 | 0٫30% |
29.400 | 0٫65% |
33.000 | 0٫73% |
34.600 | 0٫77% |
4.498.600 |
| تعداد 1931 | 3.473.000 | 65٫45% |
598.900 | 11٫29% |
289.600 | 5٫46% |
818.500 | 15٫43% |
16.000 | 0٫30% |
32.300 | 0٫61% |
36.300 | 0٫68% |
41.800 | 0٫79% |
5.306.000 |
| تعداد 1946 [ت] | 4.620.500 | 69٫41% |
733.700 | 11٫02% |
373.600 | 5٫61% |
780.600 | 11٫73% |
22.500 | 0٫34% |
41.900 | 0٫63% |
35.600 | 0٫53% |
48.900 | 0٫73% |
6.657.300 |
| تعداد 1953 [ث] | 5.616.700 | 69٫36% |
884.700 | 10٫93% |
464.000 | 5٫73% |
974.100 | 12٫03% |
25.400 | 0٫31% |
46.000 | 0٫57% |
47.500 | 0٫59% |
39.500 | 0٫49% |
8.097.900 |
| تعداد 1963 | 7.512.900 | 71٫00% |
1.164.700 | 11٫01% |
626.800 | 5٫92% |
1.123.000 | 10٫61% |
33.400 | 0٫32% |
45.900 | 0٫43% |
55.400 | 0٫52% |
19.900 | 0٫19% |
10.582.000 |
| تعداد 1971 | 9.131.241 | 71٫96% |
1.423.981 | 11٫22% |
855.724 | 6٫74% |
1.174.606 | 9٫26% |
43.459 | 0٫34% |
45.376 | 0٫36% |
15,510 | 0٫12% |
12.689.897 | ||
| تعداد 1981 | 10.979.561 | 73٫95% |
1.886.872 | 12٫71% |
1.046.926 | 7٫05% |
818.656 | 5٫51% |
46.963 | 0٫32% |
39.374 | 0٫27% |
28.398 | 0٫19% |
14.846.750 | ||
| تعداد 2001 [ج] | |||||||||||||||||
| تعداد 2011 [ح] | 15.250.081 | 74٫90% |
2.269.266 | 11٫15% |
1.892.638 | 9٫30% |
839.504 | 4٫12% |
44.130 | 0٫22% |
38.293 | 0٫19% |
25.527 | 0٫13% |
20.359.439 | ||
| تعداد 2024 [34] | 16.144.037 | 74٫10% |
2.681.627 | 12٫30% |
2.283.246 | 10٫50% |
600.360 | 2٫08% |
72.530 | 0٫30% |
21.781.800 | ||||||
- البيانات من تعداد 2011
-
 السنهاليون.
 -
 التاميل السريلانكيون.
 -
 المور السريلانكيون.
 -
 الملاياگا.


اللغات

Sinhala, an Indo-Aryan language, is the first language of Sinhalese people. Unlike Tamil Sinhala language is not found in India and is unique to Sri Lanka.
Tamil, a Dravidian language, is the first language of native Sri Lankan Tamils. Tamil is also the first language of the majority of Sri Lankan Moors and the Indian Tamils - according to the 2012 census 98% of Sri Lankan Moors could speak Tamil but only 59% could speak Sinhala.[35]
English is fluently spoken by approximately 23.8%[36] of the Sri Lanka's population, and widely used for official and commercial purposes.
Malays speak Sri Lanka Malay, a Creole language mixing Sinhala, Tamil and Malay. Many of the Burghers speak Sri Lankan Indo-Portuguese although its use has declined and the majority now speak Sinhala.[35] The Veddas speak Vedda, a Creole language closely based on Sinhala. Use of English has declined since independence, but it continues to be spoken by many in the middle and upper middle classes, particularly in Colombo. According to the 2012 census 24% of the population could speak English.[35] The government is seeking to reverse the decline in the use of English, mainly for economic but also for political reasons. According to the constitution Sinhala and Tamil are official languages whilst English is the link language.[37]
الديانات

الدين في سريلانكا (2012)[38]
According to the 2012 census Buddhists make up 70.2% of the population, Hindus 12.6%, Muslims 9.7% and Christians 7.6%.[39] The Sinhalese are predominantly Buddhist, the majority of Tamils practice Hinduism, and Moors and Malays are mostly Muslim. Sizeable minorities of both Sinhalese and Tamils are Christians, most of whom are Roman Catholic. The Burgher population is mostly Roman Catholic or Presbyterian. The Veddas have Animist and Buddhist practices. The 1978 constitution, while assuring freedom of religion, gives "the foremost place" to Buddhism.[40][41]
| السنة | البوذية | الهندوسية | الإسلام | المسيحية | أخرى | الإجمالي | ||||||
|---|---|---|---|---|---|---|---|---|---|---|---|---|
| العدد | % | العدد | % | العدد | % | العدد | % | العدد | % | No. | ||
| تعداد 1881 | 1.698.100 | 61٫53% |
593.600 | 21٫51% |
197.800 | 7٫17% |
268.000 | 9٫71% |
2.300 | 0٫08% |
2.759.800 | |
| تعداد 1891 | 1.877.000 | 62٫40% |
615.900 | 20٫48% |
212.000 | 7٫05% |
302.100 | 10٫04% |
800 | 0٫03% |
3.007.800 | |
| تعداد 1901 | 2.141.400 | 60٫06% |
826.800 | 23٫19% |
246.100 | 6٫90% |
349.200 | 9٫79% |
2.500 | 0٫07% |
3.566.000 | |
| تعداد 1911 | 2.474.200 | 60٫25% |
938.300 | 22٫85% |
283.600 | 6٫91% |
409.200 | 9٫96% |
1.100 | 0٫03% |
4.106.400 | |
| تعداد 1921 | 2.769.800 | 61٫57% |
982.100 | 21٫83% |
302.500 | 6٫72% |
443.400 | 9٫86% |
800 | 0٫02% |
4.498.600 | |
| تقديرات 1931 | 3.266.600 | 61٫55% |
1.166.900 | 21٫99% |
354.200 | 6٫67% |
518.100 | 9٫76% |
1.100 | 0٫02% |
5.306.900 | |
| تعداد 1946 | 4.294.900 | 64٫51% |
1.320.400 | 19٫83% |
436.600 | 6٫56% |
603.200 | 9٫06% |
2.200 | 0٫03% |
6.657.300 | |
| تعداد 1953 | 5.209.400 | 64٫33% |
1.610.500 | 19٫89% |
541.500 | 6٫69% |
724.400 | 8٫95% |
12.100 | 0٫15% |
8.097.900 | |
| تعداد 1963 | 7.003.300 | 66٫18% |
1.958.400 | 18٫51% |
724.000 | 6٫84% |
884.900 | 8٫36% |
11.400 | 0٫11% |
10.582.000 | |
| تعداد 1971 | 8.536.868 | 67٫27% |
2.238.666 | 17٫64% |
901.785 | 7٫11% |
1.004.326 | 7٫91% |
8.252 | 0٫07% |
12.689.897 | |
| تعداد 1981 | 10.288.325 | 69٫30% |
2.297.806 | 15٫48% |
1.121.717 | 7٫56% |
1.130.568 | 7٫61% |
8.334 | 0٫06% |
14.846.750 | |
| تعداد 2001 [ج] | ||||||||||||
| تعداد 2012 [ح] | 14.272.056 | 70٫10% |
2.561.299 | 12٫58% |
1.967.523 | 9٫66% |
1.552.161 | 7٫62% |
6.400 | 0٫03% |
20.359.439 | |
الهجرة
إلى سريلانكا
بحسب تقسيم الأمم المتحدة للسكان، بلغ عدد الأشخاص المولودين في الخارج الذين يعيشون في سريلانكا 40.018 شخصاً عام 2017.[44]
| بلد الميلاد | العدد (2017) |
|---|---|
| 10.814 | |
| 5.107 | |
| 2.482 | |
| 1.755 | |
| 1.689 | |
| 1.417 | |
| 1.409 | |
| 1.193 | |
| 925 | |
| 849 | |
| 829 | |
| 741 | |
| 674 | |
| 613 | |
| 612 | |
| 611 | |
| 561 |
الهجرة الصافية
| الفترة الزمنية | السنة | الهجرة الصافية | عداد السكان منتصف السنة (‘000) |
|---|---|---|---|
| يوليو 2012 – يونيو 2013 | 2013 | -71.730 | 20.483 |
| يوليو 2013 – يونيو 2014 | 2014 | -44.714 | 20.675 |
| يوليو 2014 – يونيو 2015 | 2015 | -17.055 | 20.870 |
| يوليو 2015 – يونيو 2016 | 2016 | 34.995 | 21.107 |
| يوليو 2016 – يونيو 2017 | 2017 | 57.028 | 21.351 |
| يوليو 2017 – يونيو 2018 | 2018* | 32.826 | 21.574 |
| يوليو 2018 – يونيو 2019 | 2019* | -54.681 | 21.707 |
| يوليو 2019 – يونيو 2020 | 2020* | -44.160 | 21.919 |
| يوليو 2020 – يونيو 2021 | 2021* | 77.600 | 22.152 |
| يوليو 2021 – يونيو 2022 | 2022* | -85.572 | 22.177 |
| ر2022 – يونيو 2023 | 2023* | -222.715 | 22.033 |
| يوليو 2023 – يونيو 2024 | 2024* | -176.932 | 21.889 |
ملاحظة: * بيانات أولية. [45]
الهوامش
- ^ أ ب Indian Tamils were only classified as a separate ethnic group from 1911 onwards. Prior to this they were included with Sri Lankan Tamils.
- ^ أ ب Indian Moors were only classified as a separate ethnic group from 1911 to 1971. Prior to 1911 they were included with Sri Lankan Moors. After 1971 they were included with Others.
- ^ The 1941 Census was postponed due to World War II.
- ^ The 1951 Census was postponed due to a shortage of paper at the time.
- ^ أ ب 2001 Census was only carried out in 18 of the 25 districts. Inclusion of data would be misleading.
- ^ أ ب The official census dates for the 2011 Census was 20 March 2012.
المصادر
- ^ "Census of Population and Housing 2024 Enumeration Stage".
- ^ "Sri Lanka's total fertility rate drops to just 1.97 in 2023 – Experts". 20 August 2024.
- ^ أ ب ت ث ج ح خ د Registrar General's Department. "Mid-year Population Estimates by Age Group and Sex, 2014 - 2019" (PDF). Archived from the original (PDF) on 17 November 2017. Retrieved 21 October 2020.
- ^ The Population of Sri Lanka (PDF). Population Growth: C.I.C.R.E.D. Series. 1974. pp. 3–4. Archived (PDF) from the original on 1 July 2014. Retrieved 2 August 2014.
- ^ Census of Population Sri Lanka 1971 - General Report. Department of Census & Statistics, Lanka. 1977. p. 18. Archived from the original on 2013-12-24.
- ^ "Table 2.1: Population by sex and district, census years" (PDF). Statistical Abstract 2013. Department of Census & Statistics, Sri Lanka. Archived from the original (PDF) on 2015-04-02.
- ^ "Population by age group and sex". LankaSIS Sri Lanka Statistical Information Service. Department of Census & Statistics, Sri Lanka. Archived from the original on 2015-04-02.
- ^ أ ب ت ث ج ح خ د "Census of Population and Housing of Sri Lanka, 2012" (PDF). Department of Census & Statistics, Sri Lanka. Archived (PDF) from the original on 2015-04-02.
- ^ "Population of Sri Lanka 1800-2020".
- ^ "Census of Population and Housing of Sri Lanka, 2012 - Table A1: Population by district, sex and sector" (PDF). Department of Census & Statistics, Sri Lanka. Archived (PDF) from the original on 2014-12-28.
- ^ "Census of Population and Housing of Sri Lanka, 2012 - Table A2: Population by district, age and sex" (PDF). Department of Census & Statistics, Sri Lanka. Archived (PDF) from the original on 2015-04-02.
- ^ "Census of Population and Housing of Sri Lanka, 2012 - Table A44: Ever married female population aged 15 years and over by number of children born alive, average children per woman, age and sector" (PDF). Department of Census & Statistics, Sri Lanka. Archived (PDF) from the original on 2015-09-24.
- ^ "Census of Population and Housing of Sri Lanka, 2012 - Table A10: Population by marital status, age, sex and sector" (PDF). Department of Census & Statistics, Sri Lanka. Archived (PDF) from the original on 2015-04-02.
- ^ "Census of Population and Housing of Sri Lanka, 2012 - Table A37 Population aged 15 years and over by economic activity status, age, sex and sector" (PDF). Department of Census & Statistics, Sri Lanka. Archived (PDF) from the original on 2015-09-24.
- ^ "Census of Population and Housing of Sri Lanka, 2012 - Table A47: Population living abroad temporary by country of usual residence, age and sex" (PDF). Department of Census & Statistics, Sri Lanka. Archived (PDF) from the original on 2015-04-02.
- ^ "Census of Population and Housing of Sri Lanka, 2012 - Table A31: Population aged 10 years and over by literacy rate, age, sex and sector" (PDF). Department of Census & Statistics, Sri Lanka. Archived (PDF) from the original on 2015-04-02.
- ^ أ ب "Census of Population and Housing of Sri Lanka, 2012 - Table A30: Population aged 5 years and over, by educational attainment, age, sex and sector" (PDF). Department of Census & Statistics, Sri Lanka. Archived (PDF) from the original on 2015-04-02.
- ^ "The Future of Population in Asia: Asia's Aging Population" (PDF). Asia Society. Archived (PDF) from the original on 8 March 2014. Retrieved 7 April 2018.
- ^ أ ب "Ageing population and elderly care in Sri Lanka". Australian National University. Archived from the original on 7 April 2018. Retrieved 7 April 2018.
- ^ أ ب "How Asia's population is aging, 2015-2030 scenario". The Jakarta Post. 14 February 2018. Archived from the original on 7 April 2018. Retrieved 7 April 2018.
- ^ "Sri Lanka's ageing population poses socio-economic challenges". Lanka Business Online. 20 April 2016. Archived from the original on 7 April 2018. Retrieved 7 April 2018.
- ^ "UNSD — Demographic and Social Statistics".
- ^ "World Population Prospects - Population Division - United Nations". esa.un.org. Archived from the original on 6 May 2011.
- ^ "Demographic and Social Statistics". UN Statistics Division. Retrieved 29 July 2020.
- ^ "Department of Census and Statistics". www.statistics.gov.lk. Retrieved 2022-11-30.
- ^ https://www.statistics.gov.lk/Population/StaticalInformation/VitalStatistics/MidYearPopulation_web_release2025Oct_En [وصلة عارية]
- ^ "MEASURE DHS: Demographic and Health Surveys". microdata.worldbank.org. Archived from the original on 2016-09-04.
- ^ "World Population Prospects – Population Division – United Nations". Retrieved 2017-07-15.
- ^ أ ب ت ث ج "Census of Population and Housing of Sri Lanka, 2012 - Table A3: Population by district, ethnic group and sex" (PDF). Department of Census & Statistics, Sri Lanka. Archived (PDF) from the original on 2016-03-04.
- ^ أ ب Kingsbury, Damien; Kingsbury, Senior Lecturer in International Development Damien (2012-03-12). Sri Lanka and the Responsibility to Protect: Politics, Ethnicity and Genocide (in الإنجليزية). Routledge. ISBN 9781136639975.
- ^ De Silva, C.R. A History. p. 262.
- ^ "Table 2.10: Population by ethnic group and census years" (PDF). Statistical Abstract 2013. Department of Census & Statistics, Sri Lanka. Archived from the original (PDF) on 2014-08-08.
- ^ "Population by ethnic group". LankaSIS Sri Lanka Statistical Information Service. Department of Census & Statistics, Sri Lanka. Archived from the original on 2015-04-02.
- ^ https://www.statistics.gov.lk//Resource/en/Population/CPH_2024/Population_Preliminary_Report.pdf [bare URL PDF]
- ^ أ ب ت "Census of Population and Housing of Sri Lanka, 2012 - Table A32 :Population aged 10 years and over, by ability to speak, ability to read and write main languages, ethnic group, sex and sector" (PDF). Department of Census & Statistics, Sri Lanka. Archived (PDF) from the original on 2015-09-24.
- ^ "Sri Lanka – language". Retrieved 20 June 2014.
- ^ "Chapter IV - Language". Constitution of Sri Lanka. Policy Research & Information Unit, Presidential Secretariat, Sri Lanka. Archived from the original on 2003-02-03.
- ^ "South Asia ::SRI LANKA". CIA The World Factbook. 24 May 2022.
- ^ أ ب "Census of Population and Housing of Sri Lanka, 2012 - Table A4: Population by district, religion and sex" (PDF). Department of Census & Statistics, Sri Lanka. Archived (PDF) from the original on 2014-12-29.
- ^ "Chapter III - Fundamental Rights". Constitution of Sri Lanka. Policy Research & Information Unit, Presidential Secretariat, Sri Lanka. Archived from the original on 2015-11-13.
- ^ "Chapter II - Buddhism". Constitution of Sri Lanka. Policy Research & Information Unit, Presidential Secretariat, Sri Lanka. Archived from the original on 2016-03-03.
- ^ "Table 2.13: Population by religion and census years" (PDF). Statistical Abstract 2013. Department of Census & Statistics, Sri Lanka. Archived from the original (PDF) on 2015-04-02.
- ^ "Population by religion". LankaSIS Sri Lanka Statistical Information Service. Department of Census & Statistics, Sri Lanka. Archived from the original on 2015-04-02.
- ^ United Nations, Department of Economic and Social Affairs. Population Division (2017). "Trends in International Migrant Stock: The 2017 revision" (Exel). United Nations, Department of Economic and Social Affairs. Population Division. Retrieved 18 September 2020.
- ^ Department of Census & Statistics Sri Lanka. *Mid-Year Population Web Release – September 2024*. Table 1. https://www.statistics.gov.lk/Resource/en/Population/Vital_Statistics/web_release2024Sep_En.pdf
وصلات خارجية
| الشعوب الأصلية | |
|---|---|
| الشعوب التقليدية | |
| المتعددون عرقياً | |
| المهاجرون |
|
- All articles with bare URLs for citations
- Articles with bare URLs for citations from October 2025
- Articles with bare URLs for citations from December 2025
- Articles with PDF format bare URLs for citations
- Short description is different from Wikidata
- Articles with unsourced statements from March 2015
- ديموغرافيا سريلانكا