مقاطعة برلي، داكوتا الشمالية
Burleigh County | |
|---|---|
 | |
 الموقع ضمن ولاية North Dakota | |
 موقع North Dakota ضمن الولايات المتحدة | |
| الإحداثيات: 46°59′N 100°28′W / 46.98°N 100.47°W | |
| البلد | |
| State | |
| تأسست | January 4, 1873 |
| السمِيْ | Walter A. Burleigh |
| Seat | Bismarck |
| أكبر مدينة | Bismarck |
| المساحة | |
| • الإجمالي | 1٬668 ميل² (4٬320 كم²) |
| • البر | 1٬633 ميل² (4٬230 كم²) |
| • الماء | 36 ميل² (90 كم²) 2.1% |
| التعداد (2020) | |
| • الإجمالي | 98٬458 |
| • Estimate (2022) | 99٬280 ▲ |
| • الكثافة | 59/sq mi (23/km2) |
| منطقة التوقيت | UTC−6 (Central) |
| • الصيف (التوقيت الصيفي) | UTC−5 (CDT) |
| Congressional district | At-large |
| الموقع الإلكتروني | www |
برلي إنگليزية: Burleigh هي إحدى مقاطعات ولاية داكوتا الشمالية في الولايات المتحدة. As of the 2020 census, the population was 98,458,[1] making it the second-most populous county in North Dakota. Its county seat is Bismarck, the state capital.[2] The county was named for Dakota Territory political figure Walter A. Burleigh.
التاريخ
The territorial legislature created Burleigh County on January 4, 1873, annexing territory from Buffalo County. Burleigh was not organized at that time, but the organization was effected on July 16, 1873. Its boundaries were altered in 1879, 1881, 1883, and twice in 1885.[3][4]
Burleigh County is included in the Bismarck, ND Metropolitan Statistical Area, commonly called "Bismarck–Mandan".
الجغرافيا
The Missouri River flows south-southeasterly along the lower west boundary line of Burleigh County. The central part of the county is drained by south-flowing creeks. The county terrain consists of semi-arid low rolling hills, partially devoted to agriculture.[5] The terrain slopes to the south, and its western portion also slopes to the river valley. The terrain's highest point is on the upper portion of the east boundary line, at 2,060' (628m) ASL.[6] The county has a total area of 1،668 ميل مربع (4،320 km2), of which 1،633 ميل مربع (4،230 km2) is land and 36 ميل مربع (93 km2) (2.1%) is water.[7]
الطرق الرئيسية
- Invalid type: I
- Invalid type: US
- Invalid type: ND
- Invalid type: ND
- Invalid type: ND
- Invalid type: ND
المقاطعات المجاورة
- Sheridan County – north
- Kidder County – east
- Emmons County – south
- Morton County - southwest
- Oliver County – west
- McLean County – northwest
المناطق المحمية
- Arena State Game Management Area
- Bunker Lake State Game Management Area
- Canfield Lake National Wildlife Refuge
- Florence Lake National Wildlife Refuge
- Long Lake National Wildlife Refuge (part)
- Sibley Nature Park
- Wilton Mine State Game Management Area (part)
البحيرات
- Bunce Lake
- Bunker Lake
- Clear Lake
- Florence Lake
- Grass Lake
- Harriet Lake
- Horseshoe Lake
- Lonetree Lake
- Long Lake
- Mitchell Lake
- New Johns Lake (part)
- O'Brien Lake
- Pelican Lake
- Rice Lake
السكان
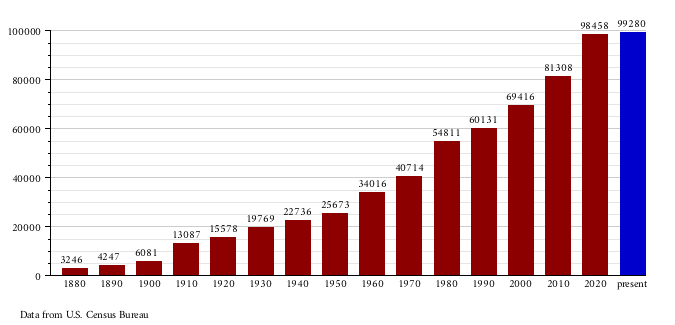
| التعداد | Pop. | ملاحظة | %± |
|---|---|---|---|
| 1880 | 3٬246 | — | |
| 1890 | 4٬247 | 30٫8% | |
| 1900 | 6٬081 | 43٫2% | |
| 1910 | 13٬087 | 115٫2% | |
| 1920 | 15٬578 | 19�0% | |
| 1930 | 19٬769 | 26٫9% | |
| 1940 | 22٬736 | 15�0% | |
| 1950 | 25٬673 | 12٫9% | |
| 1960 | 34٬016 | 32٫5% | |
| 1970 | 40٬714 | 19٫7% | |
| 1980 | 54٬811 | 34٫6% | |
| 1990 | 60٬131 | 9٫7% | |
| 2000 | 69٬416 | 15٫4% | |
| 2010 | 81٬308 | 17٫1% | |
| 2020 | 98٬458 | 21٫1% | |
| 2022 (تق.) | 99٬280 | [8] | 0٫8% |
| U.S. Decennial Census[9] 1790-1960[10] 1900-1990[11] 1990-2000[12] 2010-2020[1] | |||
تعداد 2020
As of the census of 2020, there were 98,458 people, 42,692 households, and 39,295 families in the county.
تعداد 2010
As of the census of 2010, there were 81,308 people, 33,976 households, and 21,213 families in the county. The population density was 49.8 inhabitants per square mile (19.2/km2). There were 35,754 housing units at an average density of 21.9 per square mile (8.5/km2). The racial makeup of the county was 93.0% white, 4.2% American Indian, 0.6% black or African American, 0.5% Asian, 0.3% from other races, and 1.4% from two or more races. Those of Hispanic or Latino origin made up 1.2% of the population. In terms of ancestry, 61.0% were German, 21.1% were Norwegian, 8.1% were Russian, 6.8% were Irish, and 2.6% were American.
Of the 33,976 households, 29.0% had children under the age of 18 living with them, 50.2% were married couples living together, 8.7% had a female householder with no husband present, 37.6% were non-families, and 30.5% of all households were made up of individuals. The average household size was 2.31 and the average family size was 2.90. The median age was 37.3 years.
The median income for a household in the county was $53,465 and the median income for a family was $71,103. Males had a median income of $44,944 versus $31,943 for females. The per capita income for the county was $28,784. About 6.3% of families and 9.4% of the population were below the poverty line, including 11.6% of those under age 18 and 11.0% of those age 65 or over.
التعداد حسب العقد
التجمعات
المدن
Census-designated places
Unincorporated communities
Townships
- Apple Creek
- Boyd
- Burnt Creek
- Canfield
- Christiania
- Clear Lake
- Crofte
- Cromwell
- Driscoll
- Ecklund
- Estherville
- Florence Lake
- Francis
- Ghylin
- Gibbs
- Glenview
- Grass Lake
- Harriet-Lien
- Hay Creek
- Hazel Grove
- Logan
- Long Lake
- McKenzie
- Menoken
- Missouri
- Morton
- Naughton
- Painted Woods
- Richmond
- Rock Hill
- Schrunk
- Sibley Butte
- Steiber
- Sterling
- Taft
- Telfer
- Thelma
- Trygg
- Wild Rose
- Wilson
- Wing
السياسة
Burleigh County voters have voted Republican for several decades. With the exception of 1964, no Democratic Party candidate has received even 40 percent of the county's vote after 1940.
| السنة | الجمهوري | الديمقراطي | حزب ثالث | |||
|---|---|---|---|---|---|---|
| رقم. | % | رقم. | % | رقم. | % | |
| 2020 | 34,744 | 68٫46% | 14,348 | 28٫27% | 1,661 | 3٫27% |
| 2016 | 32,532 | 67٫80% | 10,881 | 22٫68% | 4,566 | 9٫52% |
| 2012 | 27,951 | 64٫42% | 14,122 | 32٫55% | 1,314 | 3٫03% |
| 2008 | 25,443 | 60٫58% | 15,600 | 37٫14% | 956 | 2٫28% |
| 2004 | 26,577 | 68٫47% | 11,621 | 29٫94% | 616 | 1٫59% |
| 2000 | 22,467 | 65٫16% | 9,842 | 28٫54% | 2,173 | 6٫30% |
| 1996 | 15,464 | 51٫74% | 10,679 | 35٫73% | 3,747 | 12٫54% |
| 1992 | 16,484 | 50٫90% | 8,940 | 27٫61% | 6,960 | 21٫49% |
| 1988 | 18,000 | 61٫89% | 10,760 | 37�00% | 324 | 1٫11% |
| 1984 | 19,913 | 68٫25% | 8,781 | 30٫10% | 482 | 1٫65% |
| 1980 | 18,437 | 67٫94% | 6,129 | 22٫59% | 2,571 | 9٫47% |
| 1976 | 13,680 | 58٫09% | 9,188 | 39٫02% | 681 | 2٫89% |
| 1972 | 13,909 | 67٫38% | 5,841 | 28٫29% | 894 | 4٫33% |
| 1968 | 10,661 | 64٫03% | 5,139 | 30٫87% | 849 | 5٫10% |
| 1964 | 7,239 | 46٫95% | 8,120 | 52٫66% | 60 | 0٫39% |
| 1960 | 9,492 | 62٫13% | 5,761 | 37٫71% | 25 | 0٫16% |
| 1956 | 9,199 | 73٫79% | 3,231 | 25٫92% | 37 | 0٫30% |
| 1952 | 9,526 | 79٫55% | 2,400 | 20٫04% | 49 | 0٫41% |
| 1948 | 5,049 | 59٫45% | 3,117 | 36٫70% | 327 | 3٫85% |
| 1944 | 4,616 | 59٫95% | 3,061 | 39٫75% | 23 | 0٫30% |
| 1940 | 5,858 | 57٫06% | 4,350 | 42٫37% | 58 | 0٫56% |
| 1936 | 2,447 | 25٫17% | 6,314 | 64٫94% | 962 | 9٫89% |
| 1932 | 2,687 | 31٫84% | 5,621 | 66٫61% | 131 | 1٫55% |
| 1928 | 3,955 | 55٫59% | 3,076 | 43٫23% | 84 | 1٫18% |
| 1924 | 3,152 | 53٫17% | 379 | 6٫39% | 2,397 | 40٫44% |
| 1920 | 4,300 | 77٫28% | 943 | 16٫95% | 321 | 5٫77% |
| 1916 | 1,182 | 45٫46% | 1,267 | 48٫73% | 151 | 5٫81% |
| 1912 | 720 | 36٫20% | 609 | 30٫62% | 660 | 33٫18% |
| 1908 | 1,375 | 65٫82% | 660 | 31٫59% | 54 | 2٫58% |
| 1904 | 1,340 | 83٫23% | 237 | 14٫72% | 33 | 2٫05% |
| 1900 | 679 | 66٫44% | 339 | 33٫17% | 4 | 0٫39% |
Education
School districts include:[14]
K-12:
Elementary:
Former districts:
انظر أيضاً
المراجع
- ^ أ ب "State & County QuickFacts". United States Census Bureau. Retrieved مارس 30, 2023.
- ^ "Find a County". National Association of Counties. Archived from the original on مايو 31, 2011. Retrieved يونيو 7, 2011.
- ^ "Dakota Territory, South Dakota, and North Dakota: Individual County Chronologies". Dakota Territory Atlas of Historical County Boundaries. The Newberry Library. 2006. Archived from the original on أبريل 2, 2018. Retrieved فبراير 2, 2015.
- ^ "County History". North Dakota.gov. The State of North Dakota. Archived from the original on فبراير 2, 2015. Retrieved فبراير 2, 2015.
- ^ أ ب Burleigh County ND Google Maps (accessed February 16, 2019)
- ^ ""Find an Altitude/Burleigh County" Google Maps (accessed February 16, 2019)". Archived from the original on مايو 21, 2019. Retrieved فبراير 16, 2019.
- ^ "2010 Census Gazetteer Files". United States Census Bureau. أغسطس 22, 2012. Archived from the original on يناير 29, 2015. Retrieved يناير 27, 2015.
- ^ "Annual Estimates of the Resident Population for Counties: April 1, 2020 to July 1, 2022". Retrieved مارس 30, 2023.
- ^ "US Decennial Census". United States Census Bureau. Retrieved أبريل 10, 2016.
- ^ "Historical Census Browser". University of Virginia Library. Retrieved يناير 27, 2015.
- ^ Forstall, Richard L., ed. (مارس 27, 1995). "Population of Counties by Decennial Census: 1900 to 1990". US Census Bureau. Retrieved يناير 27, 2015.
- ^ "Census 2000 PHC-T-4. Ranking Tables for Counties: 1990 and 2000" (PDF). United States Census Bureau. أبريل 2, 2001. Archived (PDF) from the original on مارس 27, 2010. Retrieved يناير 27, 2015.
- ^ Leip, David. "Atlas of US Presidential Elections". uselectionatlas.org. Retrieved أبريل 12, 2018.
- ^ "2020 CENSUS - SCHOOL DISTRICT REFERENCE MAP: Burleigh County, ND" (PDF). U.S. Census Bureau. Archived (PDF) from the original on أغسطس 13, 2021. Retrieved يوليو 24, 2022. - Text list
- ^ "SCHOOL DISTRICT REFERENCE MAP (2010 CENSUS): Burleigh County, ND" (PDF). United States Census Bureau. Archived (PDF) from the original on يوليو 24, 2022. Retrieved يوليو 24, 2022. - 2010 text list
وصلات خارجية
- Burleigh County official website
- A brief history of Burleigh County : with a chronology of some of the county's earlier days (1932) from the Digital Horizons website
- A brief history of Burleigh County : with a chronology of some of the outstanding events of the county's earlier days (1932) from the Digital Horizons website
- Burleigh County maps, Sheet 1 (northern) and Sheet 2 (southern), North Dakota DOT

|
Sheridan County | McLean County |
| |
| Kidder County | Oliver County | |||
| Emmons County | Morton County |
قالب:Burleigh County, North Dakota
- Pages using gadget WikiMiniAtlas
- صفحات تستخدم خطا زمنيا
- Short description matches Wikidata
- Use mdy dates from April 2019
- Short description is different from Wikidata
- Coordinates on Wikidata
- مقاطعات North Dakota
- Pages using infobox U.S. county with unknown parameters
- Articles containing إنگليزية-language text
- Pages using Lang-xx templates
- Jct template errors
- Burleigh County, North Dakota
- Bismarck–Mandan
- North Dakota counties on the Missouri River
- 1873 establishments in Dakota Territory
- Populated places established in 1873
- مقاطعات داكوتا الشمالية