معيار نايكويست للاستقرار
في نظرية التحكم و نظرية الاستقرار، معيار نايكويست للاستقرار Nyquist stability criterion، اكتشفه مهندس الكهرباء السويدي-الأمريكي هاري نايكويست في معامل بل في 1932،[1] is a graphical technique for determining the stability of a dynamical system. Because it only looks at the رسم نايكويست Nyquist plot of the open loop systems, it can be applied without explicitly computing the poles and zeros of either the closed-loop or open-loop system (although the number of each type of right-half-plane singularities must be known). As a result, it can be applied to systems defined by non-rational functions, such as systems with delays. In contrast to Bode plots, it can handle transfer functions with right half-plane singularities. In addition, there is a natural generalization to more complex systems with multiple inputs and multiple outputs, such as control systems for airplanes.
The Nyquist criterion is widely used in electronics and control system engineering, as well as other fields, for designing and analyzing systems with feedback. While Nyquist is one of the most general stability tests, it is still restricted to linear, time-invariant (LTI) systems. Non-linear systems must use more complex stability criteria, such as Lyapunov or the circle criterion. While Nyquist is a graphical technique, it only provides a limited amount of intuition for why a system is stable or unstable, or how to modify an unstable system to be stable. Techniques like Bode plots, while less general, are sometimes a more useful design tool.
رسم نايكويست

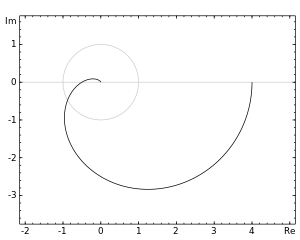
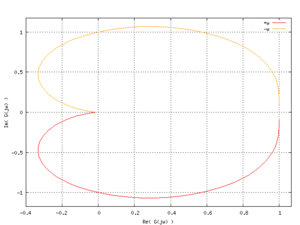
رسم نايكويست أو مخطط نايكويست هو رسم يعد بمثابة طريقة تكشف الإستجابة الترددية لنظام خطي ما ، و يطهر الرسم شكل الإستجابة على هيئة إتساع وطور في رسمة واحدة على عكس رسم بودي الذي يعرضهما في رسمتين مختلفتين.
يرسم نايكست قيمة الإستجابة و زاويتها لكل قيمة من التردد بدأ ن الصفر وحتى ما لا نهاية ، حيث أن التردد هو المتغير في رسم نايكويست وهو الذي يمثل محور السينات بينما تمثل الإستجابة بالمحور الصادي، ويمكن عبر مشاهدة الرسم و بعد القيام بعملية رياضية تسمى معيار نايكويست للإستقرار معرفة إذا ما كان النظام مستقر أو غير مستقر.
رسم نايكويست هو رسم إحداثي قطبي يقوم برسم الأرقام التخيلية (المركبة) أوجده هاري نايكويست حينما كان يعمل في معامل بل المتطورة حينها.
انظر أيضاً
- BIBO stability
- Bode plot
- Routh–Hurwitz stability criterion
- Gain margin
- Nichols plot
- Hall circles
- Phase margin
- Barkhausen stability criterion
- Circle criterion
- Control engineering
- Hankel singular value
المراجع
- Faulkner, E.A. (1969): Introduction to the Theory of Linear Systems; Chapman & Hall; ISBN 0-412-09400-2
- Pippard, A.B. (1985): Response & Stability; Cambridge University Press; ISBN 0-521-31994-3
- Gessing, R. (2004): Control fundamentals; Silesian University of Technology; ISBN 83-7335-176-0
- Franklin, G. (2002): Feedback Control of Dynamic Systems; Prentice Hall, ISBN 0-13-032393-4
وصلات خارجية
- Applets with modifiable parameters
- EIS Spectrum Analyser - a freeware program for analysis and simulation of impedance spectra
- MATLAB function for creating a Nyquist plot of a frequency response of a dynamic system model.
- PID Nyquist plot shaping - free interactive virtual tool, control loop simulator
- Mathematica function for creating the Nyquist plot
الهامش
- ^ Nyquist, H. (January 1932). "Regeneration Theory". Bell System Tech. J. USA: American Tel. & Tel. 11 (1): 126–147. doi:10.1002/j.1538-7305.1932.tb02344.x. في Alcatel-Lucent website

