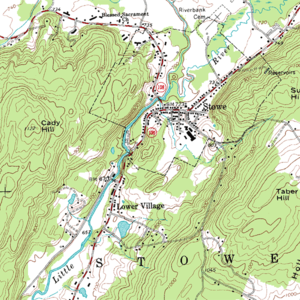
خط كونتور
خط الكونتور contour line (ويسمى أيضاً level set, isopleth, isoline, isogram أو isarithm) لدالة ذات متغيرين هو منحنى عليه تكون للدالة قيمة ثابتة.[1] In cartography, a contour line (often just called a "contour") joins points of equal elevation (height) above a given level, such as mean sea level.[2] A contour map is a map illustrated with contour lines, for example a topographic map, which thus shows valleys and hills, and the steepness of slopes.[3] The contour interval of a contour map is the difference in elevation between successive contour lines.[4]
. . . . . . . . . . . . . . . . . . . . . . . . . . . . . . . . . . . . . . . . . . . . . . . . . . . . . . . . . . . . . . . . . . . . . . . . . . . . . . . . . . . . . . . . . . . . . . . . . . . . . . . . . . . . . . . . . . . . . . . . . . . . . . . . . . . . . . . . . . . . . . . . . . . . . . . . . . . . . . . . . . . . . . . .
أنواع خطوط الكونتور
علم الأرصاد الجوية
الضغط البارومتري
خط تساوي الضغط الجوي خط يُرسم على الخرائط الجوية للربط بين الأماكن ذات الضغوط الجوية المتماثلة، ويطلق عليه أيضًا اسم الخط الأيزوباري (الأيسوبار).
الخرائط التي توضِّح مناطق الضغط الجوي المرتفع والمتوسط والمنخفض مفيدة في التنبؤ بالأحوال الجوية. وتتجه الرياح إلى الهبوب في خطوط متوازية تقريبًا مع الخطوط الأيزوبارية. ويمكن التنبؤ بحركة العواصف باستعمال الخرائط الأيزوبارية. كما يمكن بيان الضغط الجوي على الخريطة بالمليمترات الزئبقية التي تسمى مليبارات. ويمكن أن توضِّح الخريطة الأيزوبارية متوسطات الضغط الجوي طوال عام أو قد تبين الضغط الجوي في لحظة بعينها. وتوضح الخرائط اليومية الأحوال الجوية.
درجة الحرارة والمواضيع المتعلقة

الجغرافيا الطبيعية وعلم المحيطات
الارتفاع والعمق

عنونة خرائط الكونتور
انظر أيضاً
- تصميم وأنواع الخرائط
وصلات خارجية
- See also Forthright's Phrontistery for many more different types of isopleths.
- National Science Digital Library - Isobar
الهامش
|


