ملف:2006SouthAfrican exports.PNG
حجم هذه المعاينة: 800 × 351 بكسل. البعد الآخر: 1٬425 × 625 بكسل.
الملف الأصلي (1٬425 × 625 بكسل حجم الملف: 62 كيلوبايت، نوع MIME: image/png)
وصف قصير
| Description |
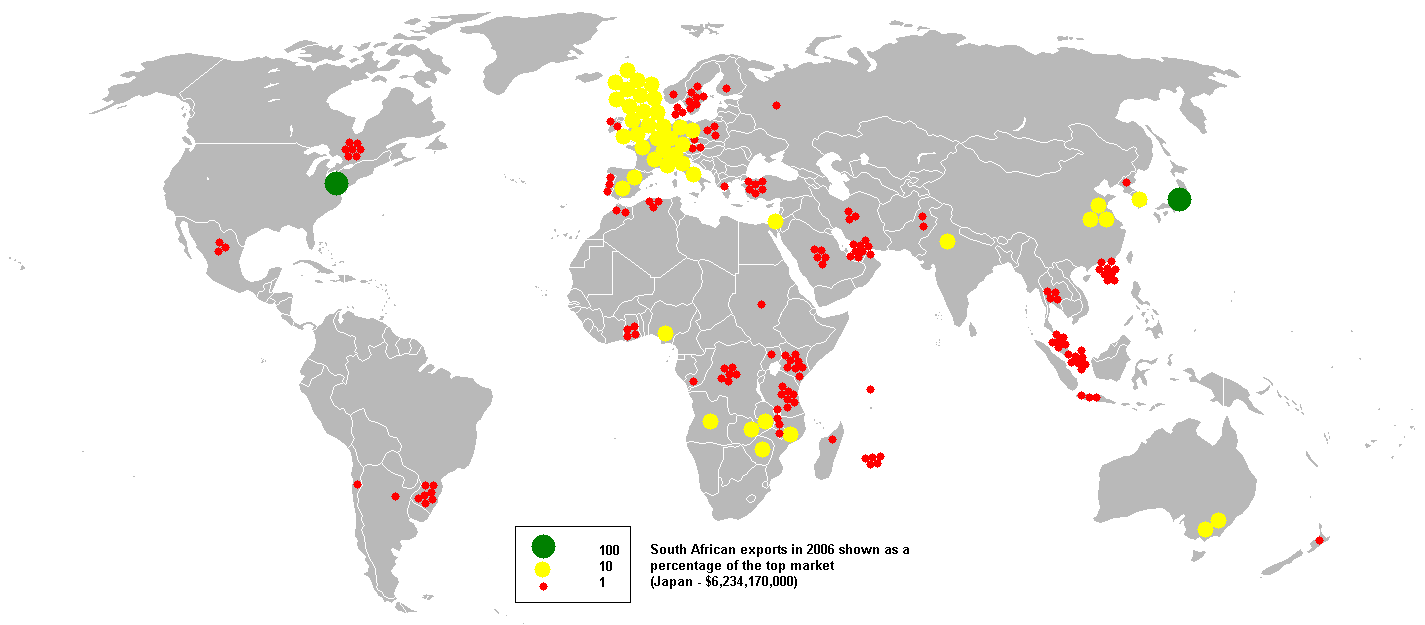
English: This bubble map shows the global distribution of South African exports in 2006 as a percentage of the top market (Japan - $6,234,170,000).
This map is consistent with incomplete set of data too as long as the top producer is known. It resolves the accessibility issues faced by colour-coded maps that may not be properly rendered in old computer screens. |
| Date | قالب:Original upload date |
| Source | self-made based on data extracted on 17th January 2008 from http://www.imfstatistics.org/DOT |
| Author | Anwar (talk) 11:55, 28 April 2008 (UTC) |
ترخيص
|
قالب:Original upload log
قالب:Transferred from قالب:Original description page
- 2008-01-17 15:30 Anwar saadat 1425×625× (63381 bytes) {{Information |Description=This bubble map shows the global distribution of South African exports in 2006 as a percentage of the top market (Japan - $6,234,170,000). This map is consistent with incomplete set of data too as long as the top producer is kn
تاريخ الملف
اضغط على زمن/تاريخ لرؤية الملف كما بدا في هذا الزمن.
| زمن/تاريخ | صورة مصغرة | الأبعاد | مستخدم | تعليق | |
|---|---|---|---|---|---|
| حالي | ★ مراجعة معتمدة 20:07، 17 يوليو 2025 | | 1٬425 × 625 (62 كيلوبايت) | Pastakhov (نقاش | مساهمات) | Upload https://upload.wikimedia.org/wikipedia/commons/9/9b/2006SouthAfrican_exports.PNG |
لا يمكنك استبدال هذا الملف.
وصلات
لا يوجد صفحات تصل لهذه الصورة.