نقاط التحول في النظام المناخي

In climate science, a tipping point is a critical threshold that, when crossed, leads to large and often irreversible changes in the climate system.[1] If tipping points are crossed, they are likely to have severe impacts on human society.[2][3] Tipping behavior is found across the climate system, in ecosystems, ice sheets, and the circulation of the ocean and atmosphere.[3]
Tipping points are often, but not necessarily, abrupt. For example, with average global warming somewhere between 0.8 °C (1.4 °F) and 3 °C (5.4 °F), the Greenland ice sheet passes a tipping point and is doomed, but its melt would take place over millennia.[4][5] Tipping points are possible at today's global warming of just over 1 °C (1.8 °F) above preindustrial times, and highly probable above 2 °C (3.6 °F) of global warming.[3] The geological record shows many abrupt changes that suggest tipping points may have been crossed in ancient times.[6] It is possible that some tipping points are close to being crossed or have already been crossed, like those of the West Antarctic and Greenland ice sheets, the Amazon rainforest and warm-water coral reefs.[7] A danger is that if the tipping point in one system is crossed, this could cause a cascade of other tipping points, leading to severe, potentially catastrophic,[8] impacts.[9]
. . . . . . . . . . . . . . . . . . . . . . . . . . . . . . . . . . . . . . . . . . . . . . . . . . . . . . . . . . . . . . . . . . . . . . . . . . . . . . . . . . . . . . . . . . . . . . . . . . . . . . . . . . . . . . . . . . . . . . . . . . . . . . . . . . . . . . . . . . . . . . . . . . . . . . . . . . . . . . . . . . . . . . . .
Definition

The sixth report from the United Nations Intergovernmental Panel on Climate Change (IPCC), released in 2021, defines a tipping point as a "critical threshold beyond which a system reorganizes, often abruptly and/or irreversibly".[10] It can be brought about by a small disturbance causing a disproportionately large change in the system. It can also be associated with self-reinforcing feedbacks, which could lead to changes in the climate system irreversible on a human timescale.[11] For any particular climate component, the shift from one state to a new stable state may take many decades or centuries.[11]
The 2019 IPCC Special Report on the Ocean and Cryosphere in a Changing Climate defines a tipping point as: "A level of change in system properties beyond which a system reorganises, often in a non-linear manner, and does not return to the initial state even if the drivers of the change are abated. For the climate system, the term refers to a critical threshold at which global or regional climate changes from one stable state to another stable state.".[12]
In ecosystems and in social systems, a tipping point can trigger a regime shift, a major systems reorganisation into a new stable state.[13] Such regime shifts need not be harmful. In the context of the climate crisis, the tipping point metaphor is sometimes used in a positive sense, such as to refer to shifts in public opinion in favor of action to mitigate climate change, or the potential for minor policy changes to rapidly accelerate the transition to a green economy.[14][15][16]
Geological record

The geological record shows that there have been abrupt changes in the climate system that indicate ancient tipping points.[6] For instance, the Dansgaard–Oeschger events during the last ice age were periods of abrupt warming (within decades) in Greenland and Europe, that may have involved the abrupt changes in major ocean currents. During the deglaciation in the early Holocene, sea level rise was not smooth, but rose abruptly during meltwater pulses. The monsoon in North Africa saw abrupt changes on decadal timescales during the African humid period. This period, spanning from 15,000 to 5,000 years ago, also ended suddenly in a drier state.
Tipping elements
Scientists have identified many elements in the climate system which may have tipping points.[17][11] In the early 2000s the IPCC began considering the possibility of tipping points, originally referred to as "large-scale discontinuities". At that time the IPCC concluded they would only be likely in the event of global warming of 4 °C (7.2 °F) or more above preindustrial times, and another early assessment placed most tipping point thresholds at 3–5 °C (5.4–9.0 °F) above 1980–1999 average warming.[18] Since then estimates for global warming thresholds have generally fallen, with some thought to be possible in the Paris Agreement range (1.5–2 °C (2.7–3.6 °F)) by 2016.[19] As of 2021 tipping points are considered to have significant probability at today's warming level of just over 1 °C (1.8 °F), with high probability above 2 °C (3.6 °F) of global warming.[3] Some tipping points may be close to being crossed or have already been crossed, like those of the ice sheets in West Antarctic and Greenland, warm-water coral reefs, and the Amazon rainforest.[20][21]
As of September 2022, nine 'global core' tipping elements and seven 'regional impact' tipping elements have been identified.[4] Out of those, one regional and three global climate elements are estimated to likely pass a tipping point if global warming reaches 1.5 °C (2.7 °F), namely Greenland ice sheet collapse, West Antarctic ice sheet collapse, tropical coral reef die off, and boreal permafrost abrupt thaw. Two further tipping points are forecast as likely if warming continues to approach 2 °C (3.6 °F): Barents sea ice abrupt loss, and the Labrador sea subpolar gyre collapse.[4][22][5]
| Proposed climate tipping element (and tipping point) | Threshold ( °C) | Timescale (years) | Maximum Impact ( °C) | ||||||
|---|---|---|---|---|---|---|---|---|---|
| Estimated | Minimum | Maximum | Estimated | Minimum | Maximum | Global | Regional | ||
| Greenland Ice Sheet (collapse) | 1.5 | 0.8 | 3.0 | 10k | 1k | 15k | 0.13 | 0.5 to 3.0 | |
| West Antarctic Ice Sheet (collapse) | 1.5 | 1.0 | 3.0 | 2k | 500 | 13k | 0.05 | 1.0 | |
| Labrador-Irminger Seas/SPG Convection (collapse) | 1.8 | 1.1 | 3.8 | 10 | 5 | 50 | -0.5 | -3.0 | |
| East Antarctic Subglacial Basins (collapse) | 3.0 | 2.0 | 6.0 | 2k | 500 | 10k | 0.05 | ? | |
| Amazon Rainforest (dieback) | 3.5 | 2.0 | 6.0 | 100 | 50 | 200 | 0.1 (partial) 0.2 (total)[T1 1] | 0.4 to 2.0 | |
| Boreal Permafrost (collapse) | 4.0 | 3.0 | 6.0 | 50 | 10 | 300 | 0.2 - 0.4[T1 2] | ~ | |
| Atlantic Meridional Overturning Circulation (collapse) | 4.0 | 1.4 | 8.0 | 50 | 15 | 300 | -0.5 | -4 to -10 | |
| Arctic Winter Sea Ice (collapse) | 6.3 | 4.5 | 8.7 | 20 | 10 | 100 | 0.6 | 0.6 to 1.2 | |
| East Antarctic Ice Sheet (collapse) | 7.5 | 5.0 | 10.0 | ? | 10k | ? | 0.6 | 2.0 | |
- ^ The paper also provides the same estimate in terms of equivalent emissions: partial dieback would be equivalent to the emissions of 30 billion tonnes of carbon, while total dieback would be equivalent to 75 billion tonnes of carbon.
- ^ The paper also provides the same estimate in terms of emissions: between 125 and 250 billion tonnes of carbon and between 175 and 350 billion tonnes of carbon equivalent.
| Proposed climate tipping element (and tipping point) | Threshold ( °C) | Timescale (years) | Maximum Impact ( °C) | ||||||
|---|---|---|---|---|---|---|---|---|---|
| Estimated | Minimum | Maximum | Estimated | Minimum | Maximum | Global | Regional | ||
| Low-latitude Coral Reefs (dieoff) | 1.5 | 1.0 | 2.0 | 10 | ~ | ~ | ~ | ~ | |
| Boreal Permafrost (abrupt thaw) | 1.5 | 1.0 | 2.3 | 200 | 100 | 300 | 0.04 per °C by 2100;0.11 per °C by 2300[T2 1] | ~ | |
| Barents Sea Ice (abrupt loss) | 1.6 | 1.5 | 1.7 | 25 | ? | ? | ~ | + | |
| Mountain Glaciers (loss) | 2.0 | 1.5 | 3.0 | 200 | 50 | 1k | 0.08 | + | |
| Sahel and W.African Monsoon (greening) | 2.8 | 2.0 | 3.5 | 50 | 10 | 500 | ~ | + | |
| Boreal Forest (southern dieoff) | 4.0 | 1.4 | 5.0 | 100 | 50 | ? | net -0.18[T2 2] | -0.5 to -2 | |
| Boreal Forest (northern expansion) | 4.0 | 1.5 | 7.2 | 100 | 40 | ? | net +0.14[T2 3] | 0.5-1.0 | |
- ^ The paper clarifies that this represents a 50% increase of gradual permafrost thaw: it also provides the same estimate in terms of emissions per each degree of warming: 10 billion tonnes of carbon and 14 billion tonnes of carbon equivalent by 2100, and 25/35 billion tonnes of carbon/carbon equivalent by 2300.
- ^ The loss of these forests would be equivalent to the emissions of 52 billion tons of carbon, but this would be more than offset by the area's albedo effect increasing and reflecting more sunlight.
- ^ Extra forest growth here would absorb around 6 billion tons of carbon, but because this area receives a lot of sunlight, this is very minor when compared to reduced albedo, as this vegetation absorbs more heat than the snow-covered ground it moves into.
Greenland ice sheet disintegration

The Greenland ice sheet is the second largest ice sheet in the world, and is three times the size of the American state of Texas.[23] The water which it holds would, if completely melted, raise sea levels globally by 7.2 metres (24 ft).[24] Due to global warming, the ice sheet is melting at an accelerating rate, adding almost 1 mm to global sea levels every year.[25] Around half of the ice loss occurs via surface melting, and the remainder occurs at the base of the ice sheet where it touches the sea, by calving (breaking off) icebergs from its margins.[26]
The Greenland ice sheet has a tipping point because of the melt-elevation feedback. Surface melting reduces the height of the ice sheet, and air at a lower altitude is warmer. The ice sheet is then exposed to warmer temperatures, accelerating its melt.[27] A 2021 analysis of sub-glacial sediment at the bottom of a 1.4 kilometres (0.87 mi) Greenland ice core finds that the Greenland ice sheet melted away at least once during the last million years, and therefore strongly suggests that its tipping point is below the 2.5 °C (4.5 °F) maximum temperature increase over the preindustrial conditions observed over that period.[28][29] There is some evidence that the Greenland ice sheet is losing stability, and getting close to a tipping point.[27]
West Antarctic ice sheet disintegration

The West Antarctic Ice Sheet (WAIS) is a large ice sheet in Antarctica; in places more than 4 kilometres (2.5 mi) thick. It sits on bedrock mostly below sea level, having formed a deep subglacial basin due to the weight of the ice sheet over millions of years.[30] As such, it is in contact with the heat from the ocean which makes it vulnerable to fast and irreversible ice loss. A tipping point could be reached once the WAIS's grounding lines (the point at which ice no longer sits on rock and becomes floating ice shelves) retreat behind the edge of the subglacial basin, resulting in self-sustaining retreat in to the deeper basin - a process known as the 'Marine Ice Sheet Instability' (MISI).[31][32] Thinning and collapse of the WAIS's ice shelves is helping to accelerate this grounding line retreat. If completely melted, the WAIS would contribute around 3.3 metres (11 ft) of sea level rise over thousands of years.[11]
Ice loss from the WAIS is accelerating, and some outlet glaciers are estimated to be close to or possibly already beyond the point of self-sustaining retreat.[33][34][35] The paleo record suggests that during the past few hundred thousand years, the WAIS largely disappeared in response to similar levels of warming and CO2 emission scenarios projected for the next few centuries.[36]
Like with the other ice sheets, there is a counteracting negative feedback - greater warming also intensifies the effects of climate change on the water cycle, which result in an increased precipitation over the ice sheet in the form of snow during the winter, which would freeze on the surface, and this increase in the surface mass balance (SMB) counteracts some fraction of the ice loss. In the IPCC Fifth Assessment Report, it was suggested that this effect could potentially overpower increased ice loss under the higher levels of warming and result in small net ice gain, but by the time of the IPCC Sixth Assessment Report, improved modelling had proven that the glacier breakup would consistently accelerate at a faster rate.[37][38]
North Subpolar Gyre
. . . . . . . . . . . . . . . . . . . . . . . . . . . . . . . . . . . . . . . . . . . . . . . . . . . . . . . . . . . . . . . . . . . . . . . . . . . . . . . . . . . . . . . . . . . . . . . . . . . . . . . . . . . . . . . . . . . . . . . . . . . . . . . . . . . . . . . . . . . . . . . . . . . . . . . . . . . . . . . . . . . . . . . .
East Antarctic ice sheet disintegration
East Antarctic ice sheet is the largest and thickest ice sheet on Earth, with the maximum thickness of 4,800 metres (3.0 mi). A complete disintegration would raise the global sea levels by 53.3 metres (175 ft), but this may not occur until global warming of 10 °C (18 °F), while the loss of two-thirds of its volume may require at least 6 °C (11 °F) of warming to trigger.[39] Its melt would also occur over a longer timescale than the loss of any other ice on the planet, taking no less than 10,000 years to finish. However, the subglacial basin portions of the East Antarctic ice sheet may be vulnerable to tipping at lower levels of warming.[5] The Wilkes Basin is of particular concern, as it holds enough ice to raise sea levels by about 3–4 metres (10–13 ft).[1]

Amazon rainforest dieback
The Amazon rainforest is the largest tropical rainforest in the world. It is twice as big as India and spans nine countries in South America. It produces around half of its own rainfall by recycling moisture through evaporation and transpiration as air moves across the forest.[11] When forest is lost via climate change (droughts and fires) or deforestation, there will be less rain and more trees will die. Eventually, large parts of the rainforest may die off and transform into a dry savanna landscape.[41] In 2022, a study reported that the rainforest has been losing resilience since the early 2000s. Resiliency is measured by recovery-time from short-term perturbations. This delayed return to equilibrium of the rainforest is termed critical slowing down. The observed loss of resilience reinforces the theory that the rainforest is approaching a critical transition.[42][43]
Permafrost thaw

Perennially frozen ground, or permafrost, covers large fractions of land – mainly in Siberia, Alaska, northern Canada and the Tibetan plateau – and can be up to a kilometre thick.[44][11] Subsea permafrost up to 100 metres thick also occurs on the sea floor under part of the Arctic Ocean.[45] This frozen ground holds vast amounts of carbon from plants and animals that died and decomposed over thousands of years. Scientists believe there is nearly twice as much carbon in permafrost than is present in Earth's atmosphere.[45] As the climate warms and the permafrost begins to thaw, carbon dioxide and methane are released into the atmosphere. With higher temperatures, microbes become active and decompose the biological material in the permafrost. This could happen rapidly, or over longer timespans, and the loss would be irreversible. Because CO2 and methane are both greenhouse gases, they act as a self-reinforcing feedback on permafrost melt.[46][47]
Atlantic Meridional Overturning Circulation

The Atlantic Meridional Overturning Circulation (AMOC), also known as the Gulf Stream System, is a large system of ocean currents.[48][49] It is driven by differences in the density of water; colder and more salty water is heavier than warmer fresh water.[49] The AMOC acts as a conveyor belt, sending warm surface water from the tropics north, and carrying cold fresh water back south.[48] As warm water flows northwards, some evaporates which increases salinity. It also cools when it is exposed to cooler air. Cold, salty water is more dense and slowly begins to sink. Several kilometres below the surface, cold, dense water begins to move south.[49] Increased rainfall and the melting of ice due to global warming dilutes the salty surface water, and warming further decreases its density. The lighter water is less able to sink, slowing down the circulation.[11]
Theory, simplified models, and reconstructions of abrupt changes in the past suggest the AMOC has a tipping point. If freshwater input from melting glaciers reaches a certain threshold, it could collapse into a state of reduced flow. Even after melting stops, the AMOC may not return to its current state. It is unlikely that the AMOC will tip in the 21st century,[50] but it may do so before 2300 if greenhouse gas emissions are very high. A weakening of 24% to 39% is expected depending on greenhouse emissions, even without tipping behaviour.[51] If the AMOC does shut down, a new stable state could emerge that lasts for thousands of years, possibly triggering other tipping points.[11]
In 2021, a study which used a "primitive" finite-difference ocean model estimated that AMOC collapse could be invoked by a sufficiently fast increase in ice melt even if it never reached the common thresholds for tipping obtained from slower change. Thus, it implied that the AMOC collapse is more likely than what is usually estimated by the complex and large-scale climate models.[52] Another 2021 study found early-warning signals in a set of AMOC indices, suggesting that the AMOC may be close to tipping.[53] However, it was contradicted by another study published in the same journal the following year, which found a "largely stable" AMOC which had so far not been affected by climate change beyond its own natural variability.[54] Two more studies published in 2022 have also suggested that the modelling approaches commonly used to evaluate AMOC appear to overestimate the risk of its collapse.[55][56]
Arctic sea ice


Arctic sea ice was once identified as a potential tipping element. The loss of sunlight-reflecting sea ice during summer exposes the (dark) ocean, which would warm. Arctic sea ice cover is likely to melt entirely under even relatively low levels of warming, and it was hypothesized that this could eventually transfer enough heat to the ocean to prevent sea ice recovery even if the global warming is reversed. Modelling now shows that this heat transfer during the Arctic summer does not overcome the cooling and the formation of new ice during the Arctic winter. As such, the loss of Arctic ice during the summer is not a tipping point for as long as the Arctic winter remains cool enough to enable the formation of new Arctic sea ice.[57][58] However, if the higher levels of warming prevent the formation of new Arctic ice even during winter, then this change may become irreversible. Consequently, Arctic Winter Sea Ice is included as a potential tipping point in a 2022 assessment.[5]
Additionally, the same assessment argued that while the rest of the ice in the Arctic Ocean may recover from a total summertime loss during the winter, ice cover in the Barents Sea may not reform during the winter even below 2 °C (3.6 °F) of warming.[5] This is because the Barents Sea is already the fastest-warming part of the Arctic: in 2021-2022 it was found that while the warming within the Arctic Circle has already been nearly four times faster than the global average since 1979,[59][60] Barents Sea warmed up to seven times faster than the global average.[61][62] This tipping point matters because of the decade-long history of research into the connections between the state of Barents-Kara Sea ice and the weather patterns elsewhere in Eurasia.[63][64][65][66][67]
. . . . . . . . . . . . . . . . . . . . . . . . . . . . . . . . . . . . . . . . . . . . . . . . . . . . . . . . . . . . . . . . . . . . . . . . . . . . . . . . . . . . . . . . . . . . . . . . . . . . . . . . . . . . . . . . . . . . . . . . . . . . . . . . . . . . . . . . . . . . . . . . . . . . . . . . . . . . . . . . . . . . . . . .
Coral reef die-off

Around 500 million people around the world depend on coral reefs for food, income, tourism and coastal protection.[68] Since the 1980s, this is being threatened by the increase in sea surface temperatures which is triggering mass bleaching of coral, especially in sub-tropical regions.[69] A sustained ocean temperature spike of 1 °C (1.8 °F) above average is enough to cause bleaching.[70] Under heat stress, corals expel the small colourful algae which live in their tissues, which causes them to turn white. The algae, known as zooxanthellae, have a symbiotic relationship with coral such that without them, the corals slowly die.[71] After these zooxanthellae have disappeared, the corals are vulnerable to a transition towards a seaweed-dominated ecosystem, making it very difficult to shift back to a coral-dominated ecosystem.[72] The IPCC estimates that by the time temperatures have risen to 1.5 °C (2.7 °F) above pre-industrial times, Coral reefs... are projected to decline by a further 70–90% at 1.5 °C; and that if the world warms by 2 °C (3.6 °F), they will become extremely rare.[73]
Mountain glaciers

Mountain glaciers are the largest repository of land-bound ice after the Greenland and the Antarctica ice sheets, and they are also undergoing melting as the result of climate change. A glacier tipping point is when it enters a disequilibrium state with the climate and will melt away unless the temperatures go down.[75][76] Examples include glaciers of the North Cascade Range, where even in 2005 67% of the glaciers observed were in disequilibrium and will not survive the continuation of the present climate,[77] or the French Alps, where The Argentière and Mer de Glace glaciers are expected to disappear completely by end of the 21st century if current climate trends persist.[78] Altogether, it was estimated in 2023 that 49% of the world's glaciers would be lost by 2100 at 1.5 °C (2.7 °F) of global warming, and 83% of glaciers would be lost at 4 °C (7.2 °F). This would amount to one quarter and nearly half of mountain glacier *mass* loss, respectively, as only the largest, most resilient glaciers would survive the century. This ice loss would also contribute ~9 cm (3+1⁄2 in) and ~15 cm (6 in) to sea level rise, while the current likely trajectory of 2.7 °C (4.9 °F) would result in the SLR contribution of ~11 cm (4+1⁄2 in) by 2100.[74]
The absolute largest amount of glacier ice is located in the Hindu Kush Himalaya region, which is colloquially known as the Earth's "Third Pole" as the result. It is believed that one third of that ice will be lost by 2100 even if the warming is limited to 1.5 °C (2.7 °F), while the "intermediate" and "severe" climate change scenarios (RCP 4.5 and 8.5) are likely to lead to the losses of 50% and >67% of the region's glaciers over the same timeframe. Glacier melt is projected to accelerate regional river flows until the amount of meltwater peaks around 2060, going into an irreversible decline afterwards. Since regional precipitation will continue to increase even as the glacier meltwater contribution declines, annual river flows are only expected to diminish in the western basins where contribution from the monsoon is low: however, irrigation and hydropower generation would still have to adjust to greater interannual variability and lower pre-monsoon flows in all of the region's rivers.[79][80][81]
Sahel greening
Boreal forest biome shift
During the last quarter of the twentieth century, the zone of latitude occupied by taiga experienced some of the greatest temperature increases on Earth. Winter temperatures have increased more than summer temperatures. In summer, the daily low temperature has increased more than the daily high temperature.[82] It has been hypothesized that the boreal environments have only a few states which are stable in the long term - a treeless tundra/steppe, a forest with >75% tree cover and an open woodland with ~20% and ~45% tree cover. Thus, continued climate change would be able to force at least some of the presently existing taiga forests into one of the two woodland states or even into a treeless steppe - but it could also shift tundra areas into woodland or forest states as they warm and become more suitable for tree growth.[83]

These trends were first detected in the Canadian boreal forests in the early 2010s,[84][85][86][87] and summer warming had also been shown to increase water stress and reduce tree growth in dry areas of the southern boreal forest in central Alaska and portions of far eastern Russia.[88] In Siberia, the taiga is converting from predominantly needle-shedding larch trees to evergreen conifers in response to a warming climate. Subsequent research in Canada found that even in the forests where biomass trends did not change, there was a substantial shift towards the deciduous broad-leaved trees with higher drought tolerance over the past 65 years,[89] and a Landsat analysis of 100,000 undisturbed sites found that the areas with low tree cover became greener in response to warming, but tree mortality (browning) became the dominant response as the proportion of existing tree cover increased.[90] A 2018 study of the seven tree species dominant in the Eastern Canadian forests found that while 2 °C (3.6 °F) warming alone increases their growth by around 13% on average, water availability is much more important than temperature and further warming of up to 4 °C (7.2 °F) would result in substantial declines unless matched by increases in precipitation.[91]
A 2021 paper had confirmed that the boreal forests are much more strongly affected by climate change than the other forest types in Canada and projected that most of the eastern Canadian boreal forests would reach a tipping point around 2080 under the RCP 8.5 scenario, which represents the largest potential increase in anthropogenic emissions.[92] Another 2021 study projected that under the "moderate" SSP2-4.5 scenario, boreal forests would experience a 15% worldwide increase in biomass by the end of the century, but this would be more than offset by the 41% biomass decline in the tropics.[93] In 2022, the results of a 5-year warming experiment in North America had shown that the juveniles of tree species which currently dominate the southern margins of the boreal forests fare the worst in response to even 1.5 °C (2.7 °F) or 3.1 °C (5.6 °F) of warming and the associated reductions in precipitation. While the temperate species which would benefit from such conditions are also present in the southern boreal forests, they are both rare and have slower growth rates.[94]
Cuvette Centrale peatland
Equatorial stratocumulus clouds
Formerly considered tipping elements
The possibility that the El Niño–Southern Oscillation (ENSO) is a tipping element had attracted attention in the past.[95] Normally strong winds blow west across the South Pacific Ocean from South America to Australia. Every two to seven years, the winds weaken due to pressure changes and the air and water in the middle of the Pacific warms up, causing changes in wind movement patterns around the globe. This is known as El Niño and typically leads to droughts in India, Indonesia and Brazil, and increased flooding in Peru. In 2015/2016, this caused food shortages affecting over 60 million people.[96] El Niño-induced droughts may increase the likelihood of forest fires in the Amazon.[97] The threshold for tipping was estimated to be between 3.5 °C (6.3 °F) and 7 °C (13 °F) of global warming in 2016.[19] After tipping, the system would be in a more permanent El Niño state, rather than oscillating between different states. This has happened in Earth's past, in the Pliocene, but the layout of the ocean was significantly different from now.[95] So far, there is no definitive evidence indicating changes in ENSO behaviour,[97] and the IPCC Sixth Assessment Report concluded that it is "virtually certain that the ENSO will remain the dominant mode of interannual variability in a warmer world."[98] Consequently, the 2022 assessment no longer includes it in the list of likely tipping elements.[5]
The Indian summer monsoon is another part of the climate system which was considered suspectible to irreversible collapse in the earlier research.[99] However, more recent research has demonstrated that warming tends to strengthen the Indian monsoon,[100] and it is projected to strengthen in the future.[101]
Methane hydrate deposits in the Arctic were once thought to be vulnerable to a rapid dissociation which would have a large impact on global temperatures, in a dramatic scenario known as a clathrate gun hypothesis. Later research found that it takes millennia for methane hydrates to respond to warming,[102] while methane emissions from the seafloor rarely transfer from the water column into the atmosphere.[103][104][105] IPCC Sixth Assessment Report states "It is very unlikely that gas clathrates (mostly methane) in deeper terrestrial permafrost and subsea clathrates will lead to a detectable departure from the emissions trajectory during this century".[106]
Mathematical theory
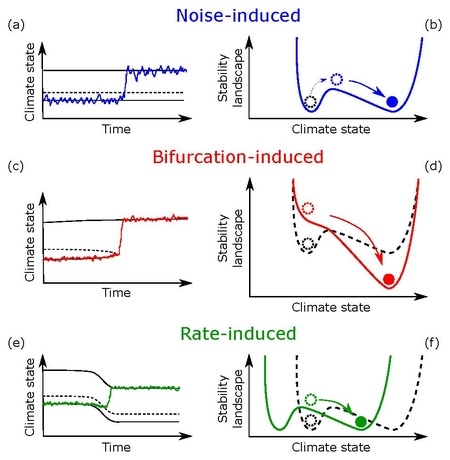
Tipping point behaviour in the climate can be described in mathematical terms. Three types of tipping points have been identified—bifurcation, noise-induced and rate-dependent.[107][108]
Bifurcation-induced tipping
Bifurcation-induced tipping happens when a particular parameter in the climate (for instance a change in environmental conditions or forcing), passes a critical level – at which point a bifurcation takes place – and what was a stable state loses its stability or simply disappears.[108][109] The Atlantic Meridional Overturning Circulation (AMOC) is an example of a tipping element that can show bifurcation-induced tipping. Slow changes to the bifurcation parameters in this system – the salinity and temperature of the water – may push the circulation towards collapse.[110][111]
Many types of bifurcations show hysteresis,[112] which is the dependence of the state of a system on its history. For instance, depending on how warm it was in the past, there can be differing amounts of ice on the poles at the same concentration of greenhouse gases or temperature.[113]
Early warning signals
For tipping points that occur because of a bifurcation, it may be possible to detect whether a system is getting closer to a tipping point, as it becomes less resilient to perturbations on approach of the tipping threshold. These systems display critical slowing down, with an increased memory (rising autocorrelation) and variance. Depending on the nature of the tipping system, there may be other types of early warning signals.[114][115] Abrupt change is not an early warning signal (EWS) for tipping points, as abrupt change can also occur if the changes are reversible to the control parameter.[116][117]
These EWSs are often developed and tested using time series from the paleo record, like sediments, ice caps, and tree rings, where past examples of tipping can be observed.[114][118] It is not always possible to say whether increased variance and autocorrelation is a precursor to tipping, or caused by internal variability, for instance in the case of the collapse of the AMOC.[118] Quality limitations of paleodata further complicate the development of EWSs.[118] They have been developed for detecting tipping due to drought in forests in California,[119] and melting of the Pine Island Glacier in West Antarctica,[117] among other systems. Using early warning signals (increased autocorrelation and variance of the melt rate time series), it has been suggested that the Greenland ice sheet is currently losing resilience, consistent with modelled early warning signals of the ice sheet.[120]
Human-induced changes in the climate system may be too fast for early warning signals to become evident, especially in systems with inertia.[121]
Noise-induced tipping
Noise-induced tipping is the transition from one state to another due to random fluctuations or internal variability of the system. Noise-induced transitions do not show any of the early warning signals which occur with bifurcations. This means they are unpredictable because the underlying potential does not change. Because they are unpredictable, such occurrences are often described as a "one-in-x-year" event.[122] An example is the Dansgaard–Oeschger events during the last ice age, with 25 occurrences of sudden climate fluctuations over a 500 year period.[123]
Rate-induced tipping
Rate-induced tipping occurs when a change in the environment is faster than the force that restores the system to its stable state.[108] In peatlands, for instance, after years of relative stability, rate-induced tipping can lead to an "explosive release of soil carbon from peatlands into the atmosphere" – sometimes known as "compost bomb instability".[124][125] The AMOC may also show rate-induced tipping: if the rate of ice melt increases too fast, it may collapse, even before the ice melt reaches the critical value where the system would undergo a bifurcation.[126]
Cascading tipping points

Crossing a threshold in one part of the climate system may trigger another tipping element to tip into a new state. Such sequences of thresholds are called cascading tipping points, an example of a domino effect.[127] Ice loss in West Antarctica and Greenland will significantly alter ocean circulation. Sustained warming of the northern high latitudes as a result of this process could activate tipping elements in that region, such as permafrost degradation, and boreal forest dieback.[1] Thawing permafrost is a threat multiplier because it holds roughly twice as much carbon as the amount currently circulating in the atmosphere.[128] Loss of ice in Greenland likely destabilises the West Antarctic ice sheet via sea level rise, and vice-versa, especially if Greenland were to melt first as West Antarctica is particularly vulnerable to contact with warm sea water.[129]
A 2021 study with three million computer simulations of a climate model showed that nearly one-third of those simulations resulted in domino effects, even when temperature increases were limited to 2 °C (3.6 °F) – the upper limit set by the Paris Agreement in 2015.[129][130] The authors of the study said that the science of tipping points is so complex that there is great uncertainty as to how they might unfold, but nevertheless, argued that the possibility of cascading tipping points represents "an existential threat to civilisation".[131] A network model analysis suggested that temporary overshoots of climate change – increasing global temperature beyond Paris Agreement goals temporarily as often projected – can substantially increase risks of climate tipping cascades ("by up to 72% compared with non-overshoot scenarios").[132][133]
Impacts

Tipping points can have very severe impacts.[1] They can exacerbate current dangerous impacts of climate change, or give rise to new impacts. Some potential tipping points would take place abruptly, such as disruptions to the Indian monsoon, with severe impacts on food security for hundreds of millions. Other impacts would likely take place over longer timescales, such as the melt of the ice caps. The 10 metres (33 ft) of sea level rise from the combined melt of Greenland and West Antarctica would require moving many cities inland. A collapse of the Atlantic Overturning Circulation would alter Europe radically, and lead to about 1 metre (3+1⁄2 ft) of sea level rise in the North Atlantic.[3] These impacts could happen simultaneously in the case of cascading tipping points.[102] A review of abrupt changes over the last 30,000 years showed that tipping points can lead to a large set of cascading impacts in climate, ecological and social systems. For instance, the abrupt termination of the African humid period cascaded, and desertification and regime shifts led to the retreat of pastoral societies in North Africa and a change of dynasty in Egypt.[118]
Runaway greenhouse effect
A runaway greenhouse effect is a tipping point so extreme that oceans evaporate[134] and the water vapour escapes to space, an irreversible climate state that happened on Venus.[135] A runaway greenhouse effect has virtually no chance of being caused by people.[136]
Venus-like conditions on the Earth require a large long-term forcing that is unlikely to occur until the sun brightens by a few tens of percents, which will take a few billion years.[137]
See also
- Greenhouse and icehouse Earth
- Climate sensitivity
- Planetary boundaries
- World Scientists' Warning to Humanity
References
- ^ أ ب ت ث Lenton, Tim; Rockström, Johan; Gaffney, Owen; Rahmstorf, Stefan; Richardson, Katherine; Steffen, Will; Schellnhuber, Hans Joachim (2019). "Climate tipping points – too risky to bet against". Nature. 575 (7784): 592–595. Bibcode:2019Natur.575..592L. doi:10.1038/d41586-019-03595-0. PMID 31776487.
- ^ "Climate change driving entire planet to dangerous "global tipping point"". National Geographic. 27 نوفمبر 2019. Retrieved 17 يوليو 2022.
- ^ أ ب ت ث ج Lenton, Tim (2021). "Tipping points in the climate system". Weather. 76 (10): 325–326. Bibcode:2021Wthr...76..325L. doi:10.1002/wea.4058. ISSN 0043-1656. S2CID 238651749.
- ^ أ ب ت ث ج Armstrong McKay, David; Abrams, Jesse; Winkelmann, Ricarda; Sakschewski, Boris; Loriani, Sina; Fetzer, Ingo; Cornell, Sarah; Rockström, Johan; Staal, Arie; Lenton, Timothy (9 سبتمبر 2022). "Exceeding 1.5°C global warming could trigger multiple climate tipping points". Science (in الإنجليزية). 377 (6611): eabn7950. doi:10.1126/science.abn7950. hdl:10871/131584. ISSN 0036-8075. PMID 36074831. S2CID 252161375.
- ^ أ ب ت ث ج ح خ د Armstrong McKay, David (9 سبتمبر 2022). "Exceeding 1.5°C global warming could trigger multiple climate tipping points – paper explainer". climatetippingpoints.info (in الإنجليزية). Retrieved 2 أكتوبر 2022.
- ^ أ ب ت Brovkin, Victor; Brook, Edward; Williams, John W.; Bathiany, Sebastian; Lenton, Tim; Barton, Michael; DeConto, Robert M.; Donges, Jonathan F.; Ganopolski, Andrey; McManus, Jerry; Praetorius, Summer (2021). "Past abrupt changes, tipping points and cascading impacts in the Earth system". Nature Geoscience. 14 (8): 550–558. Bibcode:2021NatGe..14..550B. doi:10.1038/s41561-021-00790-5. ISSN 1752-0908. S2CID 236504982.
- ^ Ripple, William J; Wolf, Christopher; Newsome, Thomas M.; Gregg, Jillian W.; Lenton, Tim; Palomo, Ignacio; Eikelboom, Jasper A. J.; Law, Beverly E.; Huq, Saleemul; Duffy, Philip B.; Rockström, Johan (28 يوليو 2021). "World Scientists' Warning of a Climate Emergency 2021". BioScience. 71 (biab079): 894–898. doi:10.1093/biosci/biab079. hdl:1808/30278. ISSN 0006-3568.
- ^ Steffen, Will; Rockström, Johan; Richardson, Katherine; Lenton, Timothy M.; Folke, Carl; Liverman, Diana; Summerhayes, Colin P.; Barnosky, Anthony D.; Cornell, Sarah E.; Crucifix, Michel; Donges, Jonathan F.; Fetzer, Ingo; Lade, Steven J.; Scheffer, Marten; Winkelmann, Ricarda; Schellnhuber, Hans Joachim (14 أغسطس 2018). "Trajectories of the Earth System in the Anthropocene". Proceedings of the National Academy of Sciences (in الإنجليزية). 115 (33): 8252–8259. Bibcode:2018PNAS..115.8252S. doi:10.1073/pnas.1810141115. ISSN 0027-8424. PMC 6099852. PMID 30082409.
- ^ Wunderling, Nico; Donges, Jonathan F.; Kurths, Jürgen; Winkelmann, Ricarda (3 يونيو 2021). "Interacting tipping elements increase risk of climate domino effects under global warming". Earth System Dynamics. 12 (2): 601–619. Bibcode:2021ESD....12..601W. doi:10.5194/esd-12-601-2021. ISSN 2190-4979. S2CID 236247596. Archived from the original on 4 يونيو 2021. Retrieved 4 يونيو 2021.
- ^ "IPCC AR6 WG1 Ch4" (PDF). p. 95. Archived (PDF) from the original on 5 سبتمبر 2021. Retrieved 14 نوفمبر 2021.
- ^ أ ب ت ث ج ح خ د "Explainer: Nine "tipping points" that could be triggered by climate change". Carbon Brief. 10 فبراير 2020. Retrieved 16 يوليو 2022.
- ^ "Glossary — Special Report on the Ocean and Cryosphere in a Changing Climate". Archived from the original on 16 أغسطس 2021. Retrieved 10 يوليو 2021.
- ^ Heinze, Christoph; Blenckner, Thorsten; Martins, Helena; Rusiecka, Dagmara; Döscher, Ralf; Gehlen, Marion; Gruber, Nicolas; Holland, Elisabeth; Hov, Øystein; Joos, Fortunat; Matthews, John Brian Robin (2021). "The quiet crossing of ocean tipping points". Proceedings of the National Academy of Sciences. 118 (9): e2008478118. Bibcode:2021PNAS..11808478H. doi:10.1073/pnas.2008478118. ISSN 0027-8424. PMC 7936299. PMID 33619085.
- ^ Michael E. Mann (2021). The New Climate War: The Fight to Take Back Our Planet. PublicAffairs. pp. 231–238. ISBN 978-1-541-75822-3.
- ^ Damian Carrington (20 يناير 2023). "'Super-tipping points' could trigger cascade of climate action". the Guardian.
- ^ Lenton, Timothy M.; Benson, Scarlett; Smith, Talia; Ewer, Theodora; Lanel, Victor; Petykowski, Elizabeth; Powell, Thomas W. R.; Abrams, Jesse F.; Blomsma, Fenna; Sharpe, Simon (2022). "Operationalising positive tipping points towards global sustainability". Global Sustainability (in الإنجليزية). 5. doi:10.1017/sus.2021.30. hdl:10871/126085. ISSN 2059-4798. S2CID 235719545.
- ^ Defined in IPCC_AR6_WGI_Chapter_04 Archived 5 سبتمبر 2021 at the Wayback Machine, p.95, line 34.
- ^ Lenton, Timothy M.; Held, Hermann; Kriegler, Elmar; Hall, Jim W; Lucht, Wolfgang; Rahmstorf, Stefan; Schellnhuber, Hans Joachim (12 فبراير 2008). "Tipping elements in the Earth's climate system". PNAS. 105 (6): 1786–1793. Bibcode:2008PNAS..105.1786L. doi:10.1073/pnas.0705414105. PMC 2538841. PMID 18258748.
- ^ أ ب Schellnhuber, Hans Joachim; Rahmstorf, Stefan; Winkelmann, Ricarda (2016). "Why the right climate target was agreed in Paris". Nature Climate Change. 6 (7): 649–653. Bibcode:2016NatCC...6..649S. doi:10.1038/nclimate3013. ISSN 1758-6798.
- ^ "Critical measures of global heating reaching tipping point, study finds". the Guardian. 28 يوليو 2021.
- ^ Ripple, William J; Wolf, Christopher; Newsome, Thomas M.; Gregg, Jillian W.; Lenton, Tim; Palomo, Ignacio; Eikelboom, Jasper A. J.; Law, Beverly E.; Huq, Saleemul; Duffy, Philip B.; Rockström, Johan (28 يوليو 2021). "World Scientists' Warning of a Climate Emergency 2021". BioScience. 71 (biab079): 894–898. doi:10.1093/biosci/biab079. hdl:1808/30278. ISSN 0006-3568.
- ^ Baker, Harry (15 سبتمبر 2022). "Climate "points of no return" may be much closer than we thought". livescience.com (in الإنجليزية). Retrieved 18 سبتمبر 2022.
- ^ "Quick Facts on Ice Sheets". National Snow and Ice Data Center. Retrieved 17 يوليو 2022.
- ^ "New climate models suggest faster melting of the Greenland Ice Sheet". World Economic Forum. 21 ديسمبر 2020. Retrieved 17 يوليو 2022.
- ^ Scambos, Ted; Straneo, Fiamma; Tedesco, Marco (2021). "How fast is the Greenland ice sheet melting?". Arctic, Antarctic, and Alpine Research. 53 (1): 221–222. doi:10.1080/15230430.2021.1946241. ISSN 1523-0430. S2CID 242536272.
- ^ Todd, Joe; Christoffersen, Poul; Zwinger, Thomas; Råback, Peter; Chauché, Nolwenn; Benn, Doug; Luckman, Adrian; Ryan, Johnny; Toberg, Nick; Slater, Donald; Hubbard, Alun (2018). "A Full-Stokes 3-D Calving Model Applied to a Large Greenlandic Glacier". Journal of Geophysical Research: Earth Surface. 123 (3): 410–432. Bibcode:2018JGRF..123..410T. doi:10.1002/2017JF004349. S2CID 54546830.
- ^ أ ب Boers, Niklas; Rypdal, Martin (2021). "Critical slowing down suggests that the western Greenland Ice Sheet is close to a tipping point". Proceedings of the National Academy of Sciences. 118 (21): e2024192118. Bibcode:2021PNAS..11824192B. doi:10.1073/pnas.2024192118. ISSN 0027-8424. PMC 8166178. PMID 34001613.
- ^ Garric, Audrey (15 مارس 2021). "La calotte glaciaire du Groenland a déjà fondu au moins une fois au cours du dernier million d'années". Le Monde.
- ^ Christ, Andrew J.; Bierman, Paul R.; Schaefer, Joerg M.; Dahl-Jensen, Dorthe; Steffensen, Jørgen P.; Corbett, Lee B.; Peteet, Dorothy M.; Thomas, Elizabeth K.; Steig, Eric J.; Rittenour, Tammy M.; Tison, Jean-Louis; Blard, Pierre-Henri; Perdrial, Nicolas; Dethier, David P.; Lini, Andrea; Hidy, Alan J.; Caffee, Marc W.; Southon, John (30 مارس 2021). "A multimillion-year-old record of Greenland vegetation and glacial history preserved in sediment beneath 1.4 km of ice at Camp Century". Proceedings of the National Academy of Sciences of the United States. 118 (13): e2021442118. Bibcode:2021PNAS..11821442C. doi:10.1073/pnas.2021442118. PMC 8020747. PMID 33723012.
- ^ Fretwell, P.; Pritchard, H. D.; Vaughan, D. G.; Bamber, J. L.; Barrand, N. E.; Bell, R.; Bianchi, C.; Bingham, R. G.; Blankenship, D. D.; Casassa, G.; Catania, G. (28 فبراير 2013). "Bedmap2: improved ice bed, surface and thickness datasets for Antarctica". The Cryosphere. 7 (1): 375–393. Bibcode:2013TCry....7..375F. doi:10.5194/tc-7-375-2013. ISSN 1994-0416. S2CID 13129041.
- ^ Hulbe, Christina (2017). "Is ice sheet collapse in West Antarctica unstoppable?". Science. 356 (6341): 910–911. Bibcode:2017Sci...356..910H. doi:10.1126/science.aam9728. PMID 28572353. S2CID 206658277.
- ^ Alley, Richard B.; Anandakrishnan, Sridhar; Christianson, Knut; Horgan, Huw J.; Muto, Atsu; Parizek, Byron R.; Pollard, David; Walker, Ryan T. (2015). "Oceanic Forcing of Ice-Sheet Retreat: West Antarctica and More". Annual Review of Earth and Planetary Sciences. 43 (1): 207–231. Bibcode:2015AREPS..43..207A. doi:10.1146/annurev-earth-060614-105344. S2CID 131486847.
- ^ Shepherd, Andrew; Ivins, Erik; Rignot, Eric; Smith, Ben; van den Broeke, Michiel; Velicogna, Isabella; Whitehouse, Pippa; Briggs, Kate; Joughin, Ian; Krinner, Gerhard; Nowicki, Sophie (2018). "Mass balance of the Antarctic Ice Sheet from 1992 to 2017". Nature. 558 (7709): 219–222. Bibcode:2018Natur.558..219I. doi:10.1038/s41586-018-0179-y. hdl:2268/225208. ISSN 1476-4687. PMID 29899482. S2CID 186244208.
- ^ Feldmann, Johannes; Levermann, Anders (17 نوفمبر 2015). "Collapse of the West Antarctic Ice Sheet after local destabilization of the Amundsen Basin". Proceedings of the National Academy of Sciences. 112 (46): 14191–14196. Bibcode:2015PNAS..11214191F. doi:10.1073/pnas.1512482112. PMC 4655561. PMID 26578762.
- ^ Joughin, Ian; Smith, Benjamin E.; Medley, Brooke; Seroussi, H.; Scheuchl, B. (16 مايو 2014). "Marine Ice Sheet Collapse Potentially Under Way for the Thwaites Glacier Basin, West Antarctica". Science. 344 (6185): 735–738. Bibcode:2014Sci...344..735J. doi:10.1126/science.1249055. PMID 24821948. S2CID 206554077.
- ^ Joughin, Ian; Alley, Richard B. (2011). "Stability of the West Antarctic ice sheet in a warming world". Nature Geoscience. 4 (8): 506–513. Bibcode:2011NatGe...4..506J. doi:10.1038/ngeo1194. ISSN 1752-0908.
- ^ Justin Gillis (March 22, 2016) "Scientists Warn of Perilous Climate Shift Within Decades, Not Centuries" New York Times
- ^ Fox-Kemper, B.; Hewitt, H.T.; Xiao, C.; Aðalgeirsdóttir, G.; Drijfhout, S.S.; Edwards, T.L.; Golledge, N.R.; Hemer, M.; Kopp, R.E.; Krinner, G.; Mix, A. (2021). Masson-Delmotte, V.; Zhai, P.; Pirani, A.; Connors, S.L.; Péan, C.; Berger, S.; Caud, N.; Chen, Y.; Goldfarb, L. (eds.). "Chapter 9: Ocean, Cryosphere and Sea Level Change" (PDF). Climate Change 2021: The Physical Science Basis. Contribution of Working Group I to the Sixth Assessment Report of the Intergovernmental Panel on Climate Change. Cambridge University Press, Cambridge, UK and New York, NY, USA: 1270–1272.
- ^ Garbe, Julius; Albrecht, Torsten; Levermann, Anders; Donges, Jonathan F.; Winkelmann, Ricarda (2020). "The hysteresis of the Antarctic Ice Sheet". Nature. 585 (7826): 538–544. Bibcode:2020Natur.585..538G. doi:10.1038/s41586-020-2727-5. PMID 32968257. S2CID 221885420.
- ^ "Amazon Against the Clock: A Regional Assessment on Where and How to Protect 80% by 2025" (PDF). Amazon Watch. سبتمبر 2022. p. 8. Archived (PDF) from the original on 10 سبتمبر 2022.
Graphic 2: Current State of the Amazon by country, by percentage / Source: RAISG (Red Amazónica de Información Socioambiental Georreferenciada) Elaborated by authors.
- ^ Amigo, Ignacio (2020). "When will the Amazon hit a tipping point?". Nature. 578 (7796): 505–507. Bibcode:2020Natur.578..505A. doi:10.1038/d41586-020-00508-4. PMID 32099130. S2CID 211265824.
- ^ "Climate crisis: Amazon rainforest tipping point is looming, data shows". The Guardian. 7 مارس 2022. Retrieved 18 أبريل 2022.
- ^ Boulton, Chris A.; Lenton, Tim; Boers, Niklas (مارس 2022). "Pronounced loss of Amazon rainforest resilience since the early 2000s". Nature Climate Change. 12 (3): 271–278. Bibcode:2022NatCC..12..271B. doi:10.1038/s41558-022-01287-8. ISSN 1758-6798. S2CID 247255222.
- ^ Zhang, T.; Barry, R. G.; Knowles, K.; Heginbottom, J. A.; Brown, J. (2008). "Statistics and characteristics of permafrost and ground-ice distribution in the Northern Hemisphere". Polar Geography. 31 (1–2): 47–68. doi:10.1080/10889370802175895. ISSN 1088-937X. S2CID 129146972.
- ^ أ ب "Where is Frozen Ground?". National Snow and Ice Data Center. Retrieved 17 يوليو 2022.
- ^ Viglione, Giuliana (14 مارس 2022). "'Imminent' tipping point threatening Europe's permafrost peatlands". Carbon Brief. Retrieved 16 يوليو 2022.
- ^ Fewster, Richard E.; Morris, Paul J.; Ivanovic, Ruza F.; Swindles, Graeme T.; Peregon, Anna M.; Smith, Christopher J. (2022). "Imminent loss of climate space for permafrost peatlands in Europe and Western Siberia". Nature Climate Change. 12 (4): 373–379. Bibcode:2022NatCC..12..373F. doi:10.1038/s41558-022-01296-7. ISSN 1758-6798. S2CID 247440316. Archived from the original on 21 فبراير 2022.
- ^ أ ب Potsdam Institute for Climate Impact Research. "Gulf Stream System at its weakest in over a millennium". ScienceDaily. Retrieved 17 يوليو 2022.
- ^ أ ب ت "What is the Atlantic Meridional Overturning Circulation?". Met Office. Retrieved 26 نوفمبر 2021.
- ^ "Risk management of climate thresholds and feedbacks: Atlantic Meridional Overturning Circulation (AMOC)" (PDF). Met Office. ديسمبر 2019. Retrieved 25 نوفمبر 2020.
- ^ Fox-Kemper, Baylor; Hewitt, Helene T.; Xiao, Cunde; Aðalgeirsdóttir, Guðfinna; et al. (2021). "Chapter 9: Ocean, cryosphere, and sea level change" (PDF). IPCC AR6 WG1. Section 9.2.3.1.
- ^ Lohmann, Johannes; Ditlevsen, Peter D. (2 مارس 2021). "Risk of tipping the overturning circulation due to increasing rates of ice melt". Proceedings of the National Academy of Sciences (in الإنجليزية). 118 (9): e2017989118. Bibcode:2021PNAS..11817989L. doi:10.1073/pnas.2017989118. ISSN 0027-8424. PMC 7936283. PMID 33619095.
- ^ Boers, Niklas (2021). "Observation-based early-warning signals for a collapse of the Atlantic Meridional Overturning Circulation". Nature Climate Change. 11 (8): 680–688. Bibcode:2021NatCC..11..680B. doi:10.1038/s41558-021-01097-4. ISSN 1758-6798. S2CID 236930519.
- ^ Latif, Mojib; Sun, Jing; Visbeck, Martin; Bordbar, M. Hadi (25 أبريل 2022). "Natural variability has dominated Atlantic Meridional Overturning Circulation since 1900". Nature Climate Change. 12 (5): 455–460. Bibcode:2022NatCC..12..455L. doi:10.1038/s41558-022-01342-4. S2CID 248385988.
- ^ He, Feng; Clark, Peter U. (7 أبريل 2022). "Freshwater forcing of the Atlantic Meridional Overturning Circulation revisited". Nature Climate Change. 12 (5): 449–454. Bibcode:2022NatCC..12..449H. doi:10.1038/s41558-022-01328-2. S2CID 248004571.
- ^ Kim, Soong-Ki; Kim, Hyo-Jeong; Dijkstra, Henk A.; An, Soon-Il (11 فبراير 2022). "Slow and soft passage through tipping point of the Atlantic Meridional Overturning Circulation in a changing climate". npj Climate and Atmospheric Science. 5 (13). doi:10.1038/s41612-022-00236-8. S2CID 246705201.
- ^ "Does Arctic sea ice have a tipping point?". National Snow and Ice Data Center. 17 ديسمبر 2021. Retrieved 19 يوليو 2022.
- ^ Arias, Paola A.; Bellouin, Nicolas; Coppola, Erika; Jones, Richard G.; et al. (2021). "Technical Summary" (PDF). IPCC AR6 WG1. p. 76.
- ^ Rantanen, Mika; Karpechko, Alexey Yu; Lipponen, Antti; Nordling, Kalle; Hyvärinen, Otto; Ruosteenoja, Kimmo; Vihma, Timo; Laaksonen, Ari (11 أغسطس 2022). "The Arctic has warmed nearly four times faster than the globe since 1979". Communications Earth & Environment (in الإنجليزية). 3 (1): 168. Bibcode:2022ComEE...3..168R. doi:10.1038/s43247-022-00498-3. ISSN 2662-4435. S2CID 251498876.
- ^ "The Arctic is warming four times faster than the rest of the world". Science Magazine (in الإنجليزية). 14 ديسمبر 2021. Retrieved 6 أكتوبر 2022.
- ^ Isaksen, Ketil; Nordli, Øyvind; et al. (15 يونيو 2022). "Exceptional warming over the Barents area". Scientific Reports (in الإنجليزية). 12 (1): 9371. Bibcode:2022NatSR..12.9371I. doi:10.1038/s41598-022-13568-5. PMC 9200822. PMID 35705593.
- ^ Damian Carrington (15 يونيو 2022). "New data reveals extraordinary global heating in the Arctic". The Guardian (in الإنجليزية). Retrieved 7 أكتوبر 2022.
- ^ Petoukhov, Vladimir; Semenov, Vladimir A. (2010). "A link between reduced Barents-Kara sea ice and cold winter extremes over northern continents" (PDF). Journal of Geophysical Research. 115 (D21): D21111. Bibcode:2010JGRD..11521111P. doi:10.1029/2009JD013568.
- ^ He, Shengping; Gao, Yongqi; Furevik, Tore; Wang, Huijun; Li, Fei (16 ديسمبر 2017). "Teleconnection between sea ice in the Barents Sea in June and the Silk Road, Pacific–Japan and East Asian rainfall patterns in August". Advances in Atmospheric Sciences. 35: 52–64. doi:10.1007/s00376-017-7029-y. S2CID 125312203.
- ^ Zhang, Ruonan; Screen, James A. (16 يونيو 2021). "Diverse Eurasian Winter Temperature Responses to Barents-Kara Sea Ice Anomalies of Different Magnitudes and Seasonality". Geophysical Research Letters. 48 (13). Bibcode:2021GeoRL..4892726Z. doi:10.1029/2021GL092726. S2CID 236235248.
- ^ Song, Mirong; Wang, Zhao-Yin; Zhu, Zhu; Liu, Ji-Ping (أغسطس 2021). "Nonlinear changes in cold spell and heat wave arising from Arctic sea-ice loss". Advances in Climate Change Research. 12 (4): 553–562. Bibcode:2021ACCR...12..553S. doi:10.1016/j.accre.2021.08.003. S2CID 238716298.
- ^ Sun, Jianqi; Liu, Sichang; Cohen, Judah; Yu, Shui (2 أغسطس 2022). "Influence and prediction value of Arctic sea ice for spring Eurasian extreme heat events". Communications Earth & Environment. 3 (1): 172. Bibcode:2022ComEE...3..172S. doi:10.1038/s43247-022-00503-9. S2CID 251230011.
- ^ Gibbens, Sarah (4 يونيو 2020). "The world's coral reefs are dying—here's how scientists plan to save them". National Geographic. Retrieved 17 يوليو 2022.
- ^ Hughes, Terry P.; Kerry, James T.; Álvarez-Noriega, Mariana; Álvarez-Romero, Jorge G.; Anderson, Kristen D.; Baird, Andrew H.; Babcock, Russell C.; Beger, Maria; Bellwood, David R.; Berkelmans, Ray; Bridge, Tom C. (2017). "Global warming and recurrent mass bleaching of corals". Nature. 543 (7645): 373–377. Bibcode:2017Natur.543..373H. doi:10.1038/nature21707. hdl:20.500.11937/52828. ISSN 1476-4687. PMID 28300113. S2CID 205254779.
- ^ Worland, Justin. "Explore This Coral Reef Before it Disappears". Time. Retrieved 17 يوليو 2022.
- ^ Gilmour, James Paton; Green, Rebecca (21 مايو 2019). "'Bright white skeletons': some Western Australian reefs have the lowest coral cover on record". The Conversation. Retrieved 17 يوليو 2022.
- ^ Holbrook, Sally J.; Schmitt, Russell J.; Adam, Thomas C.; Brooks, Andrew J. (2016). "Coral Reef Resilience, Tipping Points and the Strength of Herbivory". Scientific Reports. 6 (1): 35817. Bibcode:2016NatSR...635817H. doi:10.1038/srep35817. ISSN 2045-2322. PMC 5090207. PMID 27804977.
- ^ IPCC (2018). "Summary for Policymakers" (PDF). Global warming of 1.5°C: An IPCC Special Report on the impacts of global warming of 1.5°C. p. 8.
- ^ أ ب Rounce, David R.; Hock, Regine; Maussion, Fabien; Hugonnet, Romain; et al. (5 يناير 2023). "Global glacier change in the 21st century: Every increase in temperature matters". Science. 379 (6627): 78–83. Bibcode:2023Sci...379...78R. doi:10.1126/science.abo1324. PMID 36603094. S2CID 255441012.
- ^ Hubbard, Bryn; Neil F. Glasser (20 مايو 2005). Field Techniques in Glaciology and Glacial Geomorphology. Wiley. pp. 179–198. ISBN 978-0470844274. Retrieved 23 نوفمبر 2020.
- ^ Pelto, M.S. (2010). "Forecasting temperate alpine glacier survival from accumulation zone observations". The Cryosphere. 4 (1): 67–75. Bibcode:2010TCry....4...67P. doi:10.5194/tc-4-67-2010. Retrieved 23 نوفمبر 2020.
- ^ Mauri S. Pelto. "North Cascade Glacier Terminus Behavior". Nichols College. Retrieved 7 أغسطس 2016.
- ^ Vaughn, Adam (18 سبتمبر 2019). "Special report: How climate change is melting France's largest glacier". New Scientist. Retrieved 3 فبراير 2021.
- ^ Damian Carrington (4 فبراير 2019). "A third of Himalayan ice cap doomed, finds report". TheGuardian.com. Retrieved 20 أكتوبر 2022.
- ^ Bolch, Tobias; Shea, Joseph M.; Liu, Shiyin; Azam, Farooq M.; Gao, Yang; Gruber, Stephan; Immerzeel, Walter W.; Kulkarni, Anil; Li, Huilin; Tahir, Adnan A.; Zhang, Guoqing; Zhang, Yinsheng (5 يناير 2019). "Status and Change of the Cryosphere in the Extended Hindu Kush Himalaya Region". The Hindu Kush Himalaya Assessment: Mountains, Climate Change, Sustainability and People. Springer. pp. 209–255. doi:10.1007/978-3-319-92288-1_3. ISBN 9783319922881. S2CID 134572569.
- ^ Scott, Christopher A.; Zhang, Fan; Mukherji, Aditi; Immerzeel, Walter; Mustafa, Daanish; Bharati, Luna (5 يناير 2019). "Water in the Hindu Kush Himalaya". The Hindu Kush Himalaya Assessment: Mountains, Climate Change, Sustainability and People. pp. 257–299. doi:10.1007/978-3-319-92288-1_8. ISBN 978-3-319-92287-4. S2CID 133800578.
- ^ Wilmking, M. (9 أكتوبر 2009). "Coincidence and Contradiction in the Warming Boreal Forest". Geophysical Research Letters. 32 (15): L15715. Bibcode:2005GeoRL..3215715W. doi:10.1029/2005GL023331. Retrieved 14 يناير 2012.
- ^ Scheffer, Marten; Hirota, Marina; Holmgren, Milena; Van Nes, Egbert H.; Chapin, F. Stuart (26 ديسمبر 2012). "Thresholds for boreal biome transitions". Proceedings of the National Academy of Sciences. 109 (52): 21384–21389. Bibcode:2012PNAS..10921384S. doi:10.1073/pnas.1219844110. ISSN 0027-8424. PMC 3535627. PMID 23236159.
- ^ Peng, Changhui; Ma, Zhihai; Lei, Xiangdong; Zhu, Qiuan; Chen, Huai; Wang, Weifeng; Liu, Shirong; Li, Weizhong; Fang, Xiuqin; Zhou, Xiaolu (20 نوفمبر 2011). "A drought-induced pervasive increase in tree mortality across Canada's boreal forests". Nature Climate Change (in الإنجليزية). 1 (9): 467–471. Bibcode:2011NatCC...1..467P. doi:10.1038/nclimate1293.
- ^ Ma, Zhihai; Peng, Changhui; Zhu, Qiuan; Chen, Huai; Yu, Guirui; Li, Weizhong; Zhou, Xiaolu; Wang, Weifeng; Zhang, Wenhua (30 يناير 2012). "Regional drought-induced reduction in the biomass carbon sink of Canada's boreal forests". Biological Sciences (in الإنجليزية). 109 (7): 2423–2427. Bibcode:2012PNAS..109.2423M. doi:10.1073/pnas.1111576109. PMC 3289349. PMID 22308340.
- ^ Chen, Han Y. H.; Luo, Yong (2 يوليو 2015). "Net aboveground biomass declines of four major forest types with forest ageing and climate change in western Canada's boreal forests". Global Change Biology (in الإنجليزية). 21 (10): 3675–3684. Bibcode:2015GCBio..21.3675C. doi:10.1111/gcb.12994. PMID 26136379. S2CID 25403205.
- ^ Sulla-Menashe, Damien; Woodcock, Curtis E; Friedl, Mark A (4 يناير 2018). "Canadian boreal forest greening and browning trends: an analysis of biogeographic patterns and the relative roles of disturbance versus climate drivers". Environmental Research Letters (in الإنجليزية). 13 (1): 014007. Bibcode:2018ERL....13a4007S. doi:10.1088/1748-9326/aa9b88. S2CID 158470300.
- ^ "Boreal Forests and Climate Change - Changes in Climate Parameters and Some Responses, Effects of Warming on Tree Growth on Productive Sites". Archived from the original on 27 يوليو 2011. Retrieved 25 مارس 2011.
- ^ Hisano, Masumi; Ryo, Masahiro; Chen, Xinli; Chen, Han Y. H. (16 مايو 2021). "Rapid functional shifts across high latitude forests over the last 65 years". Global Change Biology (in الإنجليزية). 27 (16): 3846–3858. doi:10.1111/gcb.15710. PMID 33993581. S2CID 234744857.
- ^ Berner, Logan T.; Goetz, Scott J. (24 فبراير 2022). "Satellite observations document trends consistent with a boreal forest biome shift". Global Change Biology (in الإنجليزية). 28 (10): 3846–3858. doi:10.1111/gcb.16121. PMC 9303657. PMID 35199413.
- ^ D'Orangeville, Loïc; Houle, Daniel; Duchesne, Louis; Phillips, Richard P.; Bergeron, Yves; Kneeshaw, Daniel (10 أغسطس 2018). "Beneficial effects of climate warming on boreal tree growth may be transitory". Nature Communications (in الإنجليزية). 9 (1): 3213. Bibcode:2018NatCo...9.3213D. doi:10.1038/s41467-018-05705-4. PMC 6086880. PMID 30097584.
- ^ Boulanger, Yan; Puigdevall, Jesus Pascual (3 أبريل 2021). "Boreal forests will be more severely affected by projected anthropogenic climate forcing than mixedwood and northern hardwood forests in eastern Canada". Landscape Ecology (in الإنجليزية). 36 (6): 1725–1740. doi:10.1007/s10980-021-01241-7. S2CID 226959320.
- ^ Larjavaara, Markku; Lu, Xiancheng; Chen, Xia; Vastaranta, Mikko (12 أكتوبر 2021). "Impact of rising temperatures on the biomass of humid old-growth forests of the world". Carbon Balance and Management (in الإنجليزية). 16 (1): 31. doi:10.1186/s13021-021-00194-3. PMC 8513374. PMID 34642849.
{{cite journal}}: CS1 maint: unflagged free DOI (link) - ^ Reich, Peter B.; Bermudez, Raimundo; Montgomery, Rebecca A.; Rich, Roy L.; Rice, Karen E.; Hobbie, Sarah E.; Stefanski, Artur (10 أغسطس 2022). "Even modest climate change may lead to major transitions in boreal forests". Nature (in الإنجليزية). 608 (7923): 540–545. Bibcode:2022Natur.608..540R. doi:10.1038/s41586-022-05076-3. PMID 35948640. S2CID 251494296.
- ^ أ ب Wunderling, Nico; Donges, Jonathan F.; Kurths, Jürgen; Winkelmann, Ricarda (3 يونيو 2021). "Interacting tipping elements increase risk of climate domino effects under global warming". Earth System Dynamics. 12 (2): 601–619. Bibcode:2021ESD....12..601W. doi:10.5194/esd-12-601-2021. ISSN 2190-4979. S2CID 236247596.
- ^ "Tipping Points: Why we might not be able to reverse climate change". ClimateScience. Retrieved 17 يوليو 2022.
- ^ أ ب Duque-Villegas, Mateo; Salazar, Juan Fernando; Rendón, Angela Maria (2019). "Tipping the ENSO into a permanent El Niño can trigger state transitions in global terrestrial ecosystems". Earth System Dynamics. 10 (4): 631–650. Bibcode:2019ESD....10..631D. doi:10.5194/esd-10-631-2019. ISSN 2190-4979. S2CID 210348791.
- ^ Arias, Paola A.; Bellouin, Nicolas; Coppola, Erika; Jones, Richard G.; et al. (2021). "Technical Summary" (PDF). IPCC AR6 WG1. p. 88.
- ^ Stolbova, Veronika; Surovyatkina, Elena; Bookhagen, Bodo; Kurths, Jürgen (2016). "Tipping elements of the Indian monsoon: Prediction of onset and withdrawal". Geophysical Research Letters. 43 (8): 3982–3990. Bibcode:2016GeoRL..43.3982S. doi:10.1002/2016GL068392. hdl:2164/9132. S2CID 51811076.
- ^ Katzenberger, Anja; Schewe, Jacob; Pongratz, Julia; Levermann, Anders (2021). "Robust increase of Indian monsoon rainfall and its variability under future warming in CMIP-6 models". Earth System Dynamics. 12 (2): 367–386. Bibcode:2021ESD....12..367K. doi:10.5194/esd-12-367-2021. S2CID 235080216.
- ^ Arias, Paola A.; Bellouin, Nicolas; Coppola, Erika; Jones, Richard G.; et al. (2021). "Technical Summary" (PDF). IPCC AR6 WG1. p. 100.
- ^ أ ب Schellnhuber, Hans Joachim; Winkelmann, Ricarda; Scheffer, Marten; Lade, Steven J.; Fetzer, Ingo; Donges, Jonathan F.; Crucifix, Michel; Cornell, Sarah E.; Barnosky, Anthony D. (2018). "Trajectories of the Earth System in the Anthropocene". Proceedings of the National Academy of Sciences. 115 (33): 8252–8259. Bibcode:2018PNAS..115.8252S. doi:10.1073/pnas.1810141115. ISSN 0027-8424. PMC 6099852. PMID 30082409.
- ^ Sparrow, Katy J.; Kessler, John D.; Southon, John R.; Garcia-Tigreros, Fenix; Schreiner, Kathryn M.; Ruppel, Carolyn D.; Miller, John B.; Lehman, Scott J.; Xu, Xiaomei (17 يناير 2018). "Limited contribution of ancient methane to surface waters of the U.S. Beaufort Sea shelf". Science Advances. 4 (1): eaao4842. Bibcode:2018SciA....4.4842S. doi:10.1126/sciadv.aao4842. PMC 5771695. PMID 29349299.
- ^ Mau, S.; Römer, M.; Torres, M. E.; Bussmann, I.; Pape, T.; Damm, E.; Geprägs, P.; Wintersteller, P.; Hsu, C.-W.; Loher, M.; Bohrmann, G. (23 فبراير 2017). "Widespread methane seepage along the continental margin off Svalbard - from Bjørnøya to Kongsfjorden". Scientific Reports. 7: 42997. Bibcode:2017NatSR...742997M. doi:10.1038/srep42997. PMC 5322355. PMID 28230189.
- ^ Silyakova, Anna; Jansson, Pär; Serov, Pavel; Ferré, Benedicte; Pavlov, Alexey K.; Hattermann, Tore; Graves, Carolyn A.; Platt, Stephen M.; Lund Myhre, Cathrine; Gründger, Friederike; Niemann, Helge (1 فبراير 2020). "Physical controls of dynamics of methane venting from a shallow seep area west of Svalbard". Continental Shelf Research. 194: 104030. Bibcode:2020CSR...19404030S. doi:10.1016/j.csr.2019.104030. hdl:10037/16975. S2CID 214097236.
- ^ Fox-Kemper, B.; Hewitt, H.T.; Xiao, C.; Aðalgeirsdóttir, G.; Drijfhout, S.S.; Edwards, T.L.; Golledge, N.R.; Hemer, M.; Kopp, R.E.; Krinner, G.; Mix, A. (2021). Masson-Delmotte, V.; Zhai, P.; Pirani, A.; Connors, S.L.; Péan, C.; Berger, S.; Caud, N.; Chen, Y.; Goldfarb, L. (eds.). "Chapter 5: Global Carbon and other Biogeochemical Cycles and Feedbacks" (PDF). Climate Change 2021: The Physical Science Basis. Contribution of Working Group I to the Sixth Assessment Report of the Intergovernmental Panel on Climate Change. Cambridge University Press, Cambridge, UK and New York, NY, USA: 5. doi:10.1017/9781009157896.011.
- ^ Ashwin, Peter; Wieczorek, Sebastian; Vitolo, Renato; Cox, Peter (13 مارس 2012). "Tipping points in open systems: bifurcation, noise-induced and rate-dependent examples in the climate system". Philosophical Transactions of the Royal Society A: Mathematical, Physical and Engineering Sciences. 370 (1962): 1166–1184. arXiv:1103.0169. Bibcode:2012RSPTA.370.1166A. doi:10.1098/rsta.2011.0306. ISSN 1364-503X. PMID 22291228. S2CID 2324694.
- ^ أ ب ت Rietkerk, Max; Bastiaansen, Robbin; Banerjee, Swarnendu; van de Koppel, Johan; Baudena, Mara; Doelman, Arjen (8 أكتوبر 2021). "Evasion of tipping in complex systems through spatial pattern formation". Science (in الإنجليزية). 374 (6564): eabj0359. doi:10.1126/science.abj0359. ISSN 0036-8075. PMID 34618584. S2CID 238476226.
- ^ O'Keeffe, Paul E.; Wieczorek, Sebastian (1 يناير 2020). "Tipping Phenomena and Points of No Return in Ecosystems: Beyond Classical Bifurcations". SIAM Journal on Applied Dynamical Systems. 19 (4): 2371–2402. arXiv:1902.01796v7. doi:10.1137/19M1242884. S2CID 119316104.
- ^ Boulton, Chris A.; Allison, Lesley C.; Lenton, Tim (ديسمبر 2014). "Early warning signals of Atlantic Meridional Overturning Circulation collapse in a fully coupled climate model". Nature Communications. 5 (1): 5752. Bibcode:2014NatCo...5.5752B. doi:10.1038/ncomms6752. ISSN 2041-1723. PMC 4268699. PMID 25482065.
- ^ Bathiany, Sebastian; Dijkstra, Henk; Crucifix, Michel; Dakos, Vasilis; Brovkin, Victor; Williamson, Mark S.; Lenton, Tim; Scheffer, Marten (2016). "Beyond bifurcation: using complex models to understand and predict abrupt climate change". Dynamics and Statistics of the Climate System. 1 (1): dzw004. doi:10.1093/climsys/dzw004. ISSN 2059-6987.
- ^ Smith, Adam B.; Revilla, Eloy; Mindell, David P.; Matzke, Nicholas; Marshall, Charles; Kitzes, Justin; Gillespie, Rosemary; Williams, John W.; Vermeij, Geerat (2012). "Approaching a state shift in Earth's biosphere". Nature. 486 (7401): 52–58. Bibcode:2012Natur.486...52B. doi:10.1038/nature11018. hdl:10261/55208. ISSN 1476-4687. PMID 22678279. S2CID 4788164.
- ^ Pollard, David; DeConto, Robert M. (2005). "Hysteresis in Cenozoic Antarctic ice-sheet variations". Global and Planetary Change. 45 (1–3): 9–12. Bibcode:2005GPC....45....9P. doi:10.1016/j.gloplacha.2004.09.011.
- ^ أ ب Thomas, Zoë A. (15 نوفمبر 2016). "Using natural archives to detect climate and environmental tipping points in the Earth System". Quaternary Science Reviews. 152: 60–71. Bibcode:2016QSRv..152...60T. doi:10.1016/j.quascirev.2016.09.026. ISSN 0277-3791. Archived from the original on 21 نوفمبر 2021. Retrieved 20 أبريل 2020.
- ^ Lenton, Tim; Livina, V.N.; Dakos, V.; Van Nes, E.H.; Scheffer, M. (2012). "Early warning of climate tipping points from critical slowing down: comparing methods to improve robustness". Philosophical Transactions of the Royal Society A: Mathematical, Physical and Engineering Sciences. 370 (1962): 1185–1204. Bibcode:2012RSPTA.370.1185L. doi:10.1098/rsta.2011.0304. ISSN 1364-503X. PMC 3261433. PMID 22291229.
- ^ Rosier, Sebastian (6 أبريل 2021). "Guest post: Identifying three "tipping points" in Antarctica's Pine Island glacier". Carbon Brief. Archived from the original on 31 يوليو 2021. Retrieved 1 أغسطس 2021.
- ^ أ ب Rosier, Sebastian H. R.; Reese, Ronja; Donges, Jonathan F.; De Rydt, Jan; Gudmundsson, G. Hilmar; Winkelmann, Ricarda (25 مارس 2021). "The tipping points and early warning indicators for Pine Island Glacier, West Antarctica". The Cryosphere. 15 (3): 1501–1516. Bibcode:2021TCry...15.1501R. doi:10.5194/tc-15-1501-2021. ISSN 1994-0416. S2CID 233738686. Archived from the original on 1 أغسطس 2021. Retrieved 1 أغسطس 2021.
- ^ أ ب ت ث Brovkin, Victor; Brook, Edward; Williams, John W.; Bathiany, Sebastian; et al. (29 يوليو 2021). "Past abrupt changes, tipping points and cascading impacts in the Earth system". Nature Geoscience. 14 (8): 550–558. Bibcode:2021NatGe..14..550B. doi:10.1038/s41561-021-00790-5. S2CID 236504982. Archived from the original on 30 يوليو 2021. Retrieved 1 أغسطس 2021.
- ^ Liu, Yanlan; Kumar, Mukesh; Katul, Gabriel G.; Porporato, Amilcare (نوفمبر 2019). "Reduced resilience as an early warning signal of forest mortality". Nature Climate Change. 9 (11): 880–885. Bibcode:2019NatCC...9..880L. doi:10.1038/s41558-019-0583-9. ISSN 1758-6798. S2CID 203848411. Archived from the original on 1 أغسطس 2021. Retrieved 1 أغسطس 2021.
- ^ Boers, Niklas; Rypdal, Martin (25 مايو 2021). "Critical slowing down suggests that the western Greenland Ice Sheet is close to a tipping point". Proceedings of the National Academy of Sciences. 118 (21): e2024192118. Bibcode:2021PNAS..11824192B. doi:10.1073/pnas.2024192118. ISSN 0027-8424. PMC 8166178. PMID 34001613.
- ^ Chen, D.; Rojas, M.; Samset, B.H.; Cobb, K.; et al. (2021). "Chapter 1: Framing, context, and methods" (PDF). In Masson-Delmotte, V. (ed.). Climate Change 2021: The Physical Science Basis. Contribution of Working Group I to the Sixth Assessment Report of the Intergovernmental Panel on Climate Change. Section 1.4.4.3.
- ^ Lenton, Tim (2011). "Early warning of climate tipping points". Nature Climate Change. 1 (4): 201–209. Bibcode:2011NatCC...1..201L. CiteSeerX 10.1.1.666.244. doi:10.1038/nclimate1143. ISSN 1758-6798.
- ^ Ditlevsen, Peter D.; Johnsen, Sigfus J. (2010). "Tipping points: Early warning and wishful thinking". Geophysical Research Letters. 37 (19): n/a. Bibcode:2010GeoRL..3719703D. doi:10.1029/2010GL044486. ISSN 1944-8007.
- ^ Wieczorek, S.; Ashwin, P.; Luke, C. M.; Cox, P. M. (8 مايو 2011). "Excitability in ramped systems: the compost-bomb instability". Proceedings of the Royal Society A: Mathematical, Physical and Engineering Sciences. 467 (2129): 1243–1269. Bibcode:2011RSPSA.467.1243W. doi:10.1098/rspa.2010.0485. ISSN 1364-5021.
- ^ Luke, C. M.; Cox, P. M. (2011). "Soil carbon and climate change: from the Jenkinson effect to the compost-bomb instability". European Journal of Soil Science. 62 (1): 5–12. doi:10.1111/j.1365-2389.2010.01312.x. ISSN 1365-2389. S2CID 55462001. Archived from the original on 21 نوفمبر 2021. Retrieved 30 نوفمبر 2019.
- ^ Lohmann, Johannes; Ditlevsen, Peter D. (2021). "Risk of tipping the overturning circulation due to increasing rates of ice melt". Proceedings of the National Academy of Sciences. 118 (9): e2017989118. Bibcode:2021PNAS..11817989L. doi:10.1073/pnas.2017989118. ISSN 0027-8424. PMC 7936283. PMID 33619095.
- ^ Rocha, Juan C.; Peterson, Garry; Bodin, Örjan; Levin, Simon (2018). "Cascading regime shifts within and across scales". Science. 362 (6421): 1379–1383. Bibcode:2018Sci...362.1379R. doi:10.1126/science.aat7850. ISSN 0036-8075. PMID 30573623. S2CID 56582186.
- ^ "The irreversible emissions of a permafrost "tipping point"". World Economic Forum. 18 فبراير 2020. Retrieved 17 يوليو 2022.
- ^ أ ب Wunderling, Nico; Donges, Jonathan F.; Kurths, Jürgen; Winkelmann, Ricarda (3 يونيو 2021). "Interacting tipping elements increase risk of climate domino effects under global warming". Earth System Dynamics (in English). 12 (2): 601–619. Bibcode:2021ESD....12..601W. doi:10.5194/esd-12-601-2021. ISSN 2190-4979.
{{cite journal}}: CS1 maint: unrecognized language (link) - ^ Turner, Ben (12 يونيو 2021). "Dramatic climate domino effects could be unleashed after less than 2 degrees of warming, a new study reveals". livescience.com (in الإنجليزية). Retrieved 23 يوليو 2022.
- ^ Carrington, Damian (27 نوفمبر 2019). "Climate emergency: world "may have crossed tipping points"". the Guardian.
- ^ "Overshooting climate targets could significantly increase risk for tipping cascades". Potsdam Institute for Climate Impact Research via phys.org (in الإنجليزية). Retrieved 17 يناير 2023.
- ^ Wunderling, Nico; Winkelmann, Ricarda; Rockström, Johan; Loriani, Sina; Armstrong McKay, David I.; Ritchie, Paul D. L.; Sakschewski, Boris; Donges, Jonathan F. (يناير 2023). "Global warming overshoots increase risks of climate tipping cascades in a network model". Nature Climate Change (in الإنجليزية). 13 (1): 75–82. Bibcode:2023NatCC..13...75W. doi:10.1038/s41558-022-01545-9. ISSN 1758-6798. S2CID 255045153.
- ^ "What can Venus tell us about climate change on Earth?". BBC Sky at Night Magazine. Retrieved 18 يوليو 2022.
- ^ Dunbar, Brian (6 مايو 2015). "Venus". NASA. Retrieved 18 يوليو 2022.
- ^ "Scoping of the IPCC 5th Assessment Report Cross Cutting Issues". Thirty-first Session of the IPCC Bali, 26–29 October 2009. Archived from the original. You must specify the date the archive was made using the
|archivedate=parameter. https://www.ipcc.ch/site/assets/uploads/2018/03/inf3-6.pdf. Retrieved on 24 March 2019. - ^ Hansen, James; Sato, Makiko; Russell, Gary; Kharecha, Pushker (2013). "Climate sensitivity, sea level and atmospheric carbon dioxide". Philosophical Transactions of the Royal Society A: Mathematical, Physical and Engineering Sciences. 371 (2001). 20120294. arXiv:1211.4846. Bibcode:2013RSPTA.37120294H. doi:10.1098/rsta.2012.0294. PMC 3785813. PMID 24043864.
External links
- Global Systems Institute Tipping points research at Exeter University
- The climate tipping points 2022 BBC radio documentary
| تقنية | |||||
|---|---|---|---|---|---|
| اجتماعية | |||||
| بيئية |
| ||||
| بيولوجية |
| ||||
| فيزيائية | |||||
| أسطورية |
| ||||
| الخيال | |||||
- CS1 maint: unflagged free DOI
- Short description is different from Wikidata
- Articles with hatnote templates targeting a nonexistent page
- مقالات جيدة
- Use dmy dates from August 2022
- Articles with broken excerpts
- Pages using multiple image with auto scaled images
- Climate change feedbacks
- Climatology
- Politics of climate change
- Earth