ديمغرافيا البوسنة والهرسك

This article is about the demographic features of the population of البوسنة والهرسك, including population density, ethnicity, education level, health of the populace, economic status, religious affiliations and other aspects of the population.
. . . . . . . . . . . . . . . . . . . . . . . . . . . . . . . . . . . . . . . . . . . . . . . . . . . . . . . . . . . . . . . . . . . . . . . . . . . . . . . . . . . . . . . . . . . . . . . . . . . . . . . . . . . . . . . . . . . . . . . . . . . . . . . . . . . . . . . . . . . . . . . . . . . . . . . . . . . . . . . . . . . . . . . .
الإحصائيات الحيوية
| [1][2][3] | متوسط التعداد (x 1000) | المواليد الأحياء | الوفيات | التغير الطبيعي | Crude birth rate (per 1000) | Crude death rate (per 1000) | Natural change (per 1000) | Total fertility rate | Infant mortality rate (per 1000 births) | Life expectancy males | Life expectancy females |
|---|---|---|---|---|---|---|---|---|---|---|---|
| 1947 | 2 532 | 84 600 | 38 900 | 45 700 | 33.4 | 15.4 | 18.0 | ||||
| 1948 | 2 586 | 90 700 | 41 600 | 49 100 | 35.1 | 16.1 | 19.0 | ||||
| 1949 | 2 642 | 98 200 | 42 200 | 56 000 | 37.2 | 16.0 | 21.2 | ||||
| 1950 | 2 661 | 102 680 | 35 991 | 66 689 | 38.6 | 13.5 | 25.1 | ||||
| 1951 | 2 721 | 92 330 | 46 358 | 45 972 | 33.9 | 17.0 | 16.9 | ||||
| 1952 | 2 779 | 112 216 | 34 817 | 77 399 | 40.4 | 12.5 | 27.9 | ||||
| 1953 | 2 836 | 110 373 | 41 199 | 69 174 | 38.9 | 14.5 | 24.4 | ||||
| 1954 | 2 891 | 115 854 | 35 158 | 80 696 | 40.1 | 12.2 | 27.9 | ||||
| 1955 | 2 944 | 110 866 | 40 513 | 70 353 | 37.7 | 13.8 | 23.9 | ||||
| 1956 | 2 994 | 111 561 | 38 320 | 73 241 | 37.3 | 12.8 | 24.5 | ||||
| 1957 | 3 042 | 102 649 | 36 830 | 65 819 | 33.7 | 12.1 | 21.6 | ||||
| 1958 | 3 089 | 110 332 | 30 123 | 80 209 | 35.7 | 9.8 | 26.0 | ||||
| 1959 | 3 135 | 108 123 | 32 507 | 75 616 | 34.5 | 10.4 | 24.1 | ||||
| 1960 | 3 180 | 110 499 | 33 360 | 77 139 | 34.7 | 10.5 | 24.3 | ||||
| 1961 | 3 225 | 108 076 | 29 413 | 78 663 | 33.5 | 9.1 | 24.4 | ||||
| 1962 | 3 271 | 106 826 | 31 087 | 75 739 | 32.7 | 9.5 | 23.2 | ||||
| 1963 | 3 315 | 104 240 | 29 161 | 75 079 | 31.4 | 8.8 | 22.6 | ||||
| 1964 | 3 357 | 101 147 | 29 846 | 71 301 | 30.1 | 8.9 | 21.2 | ||||
| 1965 | 3 396 | 101 351 | 27 814 | 73 537 | 29.8 | 8.2 | 21.7 | ||||
| 1966 | 3 433 | 97 689 | 25 138 | 72 551 | 28.5 | 7.3 | 21.1 | ||||
| 1967 | 3 466 | 92 972 | 26 195 | 66 777 | 26.8 | 7.6 | 19.3 | ||||
| 1968 | 3 498 | 89 134 | 26 031 | 63 103 | 25.5 | 7.4 | 18.0 | ||||
| 1969 | 3 531 | 87 687 | 27 805 | 59 882 | 24.8 | 7.9 | 17.0 | ||||
| 1970 | 3 564 | 79 296 | 26 355 | 52 941 | 22.2 | 7.4 | 14.9 | ||||
| 1971 | 3 600 | 82 694 | 24 915 | 57 779 | 23.0 | 6.9 | 16.0 | ||||
| 1972 | 3 637 | 82 068 | 26 844 | 55 224 | 22.6 | 7.4 | 15.2 | ||||
| 1973 | 3 675 | 77 896 | 24 672 | 53 224 | 21.2 | 6.7 | 14.5 | ||||
| 1974 | 3 712 | 77 833 | 23 661 | 54 172 | 21.0 | 6.4 | 14.6 | ||||
| 1975 | 3 747 | 78 844 | 25 571 | 53 273 | 21.0 | 6.8 | 14.2 | ||||
| 1976 | 3 781 | 79 061 | 25 178 | 53 883 | 20.9 | 6.7 | 14.3 | ||||
| 1977 | 3 813 | 75 669 | 24 821 | 50 848 | 19.8 | 6.5 | 13.3 | ||||
| 1978 | 3 844 | 73 306 | 26 016 | 47 290 | 19.1 | 6.8 | 12.3 | ||||
| 1979 | 3 878 | 71 120 | 25 370 | 45 750 | 18.3 | 6.5 | 11.8 | ||||
| 1980 | 3 914 | 70 928 | 26 115 | 44 813 | 18.1 | 6.7 | 11.4 | ||||
| 1981 | 3 950 | 71 031 | 26 222 | 44 809 | 18.0 | 6.6 | 11.3 | ||||
| 1982 | 3 986 | 73 375 | 26 775 | 46 600 | 18.4 | 6.7 | 11.7 | ||||
| 1983 | 4 025 | 74 296 | 29 999 | 44 297 | 18.5 | 7.5 | 11.0 | ||||
| 1984 | 4 070 | 74 539 | 29 046 | 45 493 | 18.3 | 7.1 | 11.2 | ||||
| 1985 | 4 122 | 72 722 | 28 966 | 43 756 | 17.6 | 7.0 | 10.6 | ||||
| 1986 | 4 189 | 71 203 | 29 127 | 42 076 | 17.0 | 7.0 | 10.0 | ||||
| 1987 | 4 267 | 70 898 | 29 382 | 41 516 | 16.6 | 6.9 | 9.7 | ||||
| 1988 | 4 332 | 70 711 | 29 559 | 41 152 | 16.3 | 6.8 | 9.5 | ||||
| 1989 | 4 353 | 66 809 | 30 383 | 36 426 | 15.3 | 7.0 | 8.4 | ||||
| 1990 | 4 308 | 66 952 | 29 093 | 37 859 | 15.5 | 6.8 | 8.8 | ||||
| 1991 | 4 163 | 64 769 | 31 411 | 33 358 | 15.6 | 7.5 | 8.0 | ||||
| 1992 | |||||||||||
| 1993 | |||||||||||
| 1994 | |||||||||||
| 1995 | |||||||||||
| 1996 | 3 645 | 46 594 | 25 152 | 21 442 | 12.8 | 6.9 | 5.9 | 1.65 | |||
| 1997 | 3 738 | 48 397 | 27 875 | 20 522 | 12.9 | 7.5 | 5.5 | 1.68 | |||
| 1998 | 3 653 | 45 007 | 28 679 | 16 328 | 12.3 | 7.9 | 4.5 | 1.56 | |||
| 1999 | 3 725 | 42 464 | 28 637 | 13 827 | 11.4 | 7.7 | 3.7 | 1.36 | |||
| 2000 | 3 781 | 39 563 | 30 482 | 9 081 | 10.5 | 8.1 | 2.4 | 1.30 | |||
| 2001 | 3 798 | 37 717 | 30 325 | 7 392 | 9.9 | 8.0 | 1.9 | 1.40 | |||
| 2002 | 3 828 | 35 587 | 30 155 | 5 432 | 9.3 | 7.9 | 1.4 | 1.20 | |||
| 2003 | 3 833 | 35 234 | 31 757 | 3 477 | 9.2 | 8.3 | 0.9 | 1.22 | |||
| 2004 | 3 843 | 35 151 | 32 616 | 2 535 | 9.2 | 8.5 | 0.7 | 1.22 | |||
| 2005 | 3 843 | 34 627 | 34 402 | 225 | 9.0 | 9.0 | 0.1 | 1.20 | |||
| 2006 | 3 843 | 34 033 | 33 221 | 812 | 8.9 | 8.6 | 0.2 | 1.18 | |||
| 2007 | 3 843 | 33 835 | 35 044 | -1 209 | 8.8 | 9.1 | -0.3 | 1.26 | |||
| 2008 | 3 842 | 34 176 | 34 026 | 150 | 8.9 | 8.9 | 0.0 | 1.29 | |||
| 2009 | 3 843 | 34 617 | 33 983 | 634 | 9.0 | 9.0 | 0.0 | 1.30 | |||
| 2010 | 3 843 | 33 820 | 34 772 | 48 | 8.8 | 8.8 | 0.0 | 1.27 | |||
| 2011 | 3 840 | 33 779 | 34 633 | -854 | 8.8 | 9.0 | -0.2 | 1.21 | |||
| 2012 | 3 836 | 31 875 | 35 522 | -3 647 | 8.3 | 9.3 | -1.0 | 1.349 | |||
| 2013 | 3 531 | 32 072 | 35 629 | -3 620 | 9.1 | 10.1 | -1.0 | 1.276 | |||
| 2014 | 3 526 | 31 103 | 35 837 | -4 734 | 8.8 | 10.2 | -1.4 | 1.258 | |||
| 2015 | 3 517 | 28 906 | 37 070 | -8 164 | 8.2 | 10.4 | - 2.2 | ||||
| 2016 | 29 276 | 35 530 | -6 254 |
الجماعات العرقية
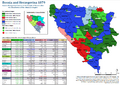
According to data from 2013 census published by the Agency for Statistics of Bosnia and Herzegovina, Bosniaks constitute 50.11% of the population, Bosnian Serbs 30.78%, Bosnian Croats 15.43%, and others form 2.73%, with the remaining respondents not declaring their ethnicity or not answering.[4] The census results are contested by the Republika Srpska statistical office and by Bosnian Serb politicians,[5] who oppose the inclusion of non-permanent Bosnian residents in the figures.[6] The European Union's statistics office, Eurostat, however concluded the methodology used by the Bosnian statistical agency to be in line with international recommendations.[7]
In Bosnia and Herzegovina, religion is often linked to ethnicity, i.e. (with the exception of agnostics and atheists) most Bosniaks are Muslim, Serbs are Orthodox Christian, and Croats are Roman Catholic.
| الجماعة العرقية |
تعداد 1948 | تعداد 1953 | تعداد 1961 | تعداد 1971 | تعداد 1981 | تعداد 1991 | تعداد UNHCR 1996 | تعداد 2013 | تغير التعداد 1991-2013 | |||||||||
|---|---|---|---|---|---|---|---|---|---|---|---|---|---|---|---|---|---|---|
| Number | % | Number | % | Number | % | Number | % | Number | % | Number | % | Number | % | Number | % | Number | % | |
| Bosniaks | 788,403 | 30.7 | 891,800 | 31.3 | 842,248 | 25.7 | 1,482,430 | 39.6 | 1,629,924 | 39.5 | 1,902,956 | 43.5 | 1,805,910 | 46.1 | 1,769,592 | 50.11 | -133,364 | +6.64% |
| Serbs | 1,136,116 | 44.3 | 1,264,372 | 44.4 | 1,406,057 | 42.9 | 1,393,148 | 37.2 | 1,320,644 | 32.0 | 1,366,104 | 31.2 | 1,484,530 | 37.9 | 1,086,733 | 30.78 | -279,371 | -0.43% |
| Croats | 614,123 | 23.9 | 654,229 | 23.0 | 711,665 | 21.7 | 772,491 | 20.6 | 758,136 | 18.4 | 760,852 | 17.4 | 571,317 | 14.6 | 544,780 | 15.43 | -216,072 | -1.95% |
| Yugoslavs | 275,883 | 8.4 | 43,796 | 1.2 | 326,280 | 7.9 | 242,682 | 5.5 | ||||||||||
| Montenegrins | 3,094 | 0.1 | 7,336 | 0.3 | 12,828 | 0.4 | 13,021 | 0.3 | 14,114 | 0.3 | 10,071 | 0.2 | ||||||
| Roma | 442 | 0.0 | 2,297 | 0.1 | 588 | 0.0 | 1,456 | 0.0 | 7,251 | 0.2 | 8,864 | 0.2 | ||||||
| Albanians | 3,642 | 0.1 | 3,764 | 0.1 | 4,396 | 0.1 | 4,925 | 0.1 | ||||||||||
| Others/undeclared | 23,099 | 0.9 | 27,756 | 1.0 | 28,679 | 0.8 | 36,005 | 1 | 63,263 | 1.5 | 80,579 | 1.9 | 58,196 | 1.5 | 130,054 | 3.62 | ||
| Total | 2,565,277 | 2,847,790 | 3,277,948 | 3,746,111 | 4,124,008 | 4,376,403 | 3,919,953 | 3,531,159 | ||||||||||
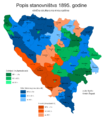
Ethnic structure in 1895

Ethnic structure of Bosnia and Herzegovina by municipalities in 2013
Ethnic structure of Bosnia and Herzegovina by municipalities in 2013
Share of Bosniaks in Bosnia and Herzegovina by municipalities in 2013
Share of Serbs in Bosnia and Herzegovina by municipalities in 2013

Share of Croats in Bosnia and Herzegovina by municipalities in 2013


اللغات
Bosnia's constitution does not specify any official languages.[8][9][10] However, academics Hilary Footitt and Michael Kelly note that the Dayton Agreement states that it is "done in Bosnian, Croatian, English and Serbian", and they describe this as the "de facto recognition of three official languages" at the state level. The equal status of Bosnian, Serbian and Croatian was verified by the Constitutional Court in 2000.[10] It ruled that the provisions of the Federation and Republika Srpska constitutions on language were incompatible with the state constitution, since they only recognised "Bosniak" and Croatian (in the case of the Federation) and Serbian (in the case of Republika Srpska) as official languages at the entity level. As a result, the wording of the entity constitutions was changed and all three languages were made official in both entities.[10] The three languages are mutually intelligible and are also known collectively as Serbo-Croatian. Use of one of the three varieties has become a marker of ethnic identity.[11] Michael Kelly and Catherine Baker argue: "The three official languages of today's Bosnian state...represent the symbolic assertion of national identity over the pragmatism of mutual intelligibility".[12] All standard varieties are based on the Ijekavian varieties of the Shtokavian dialect (non-standard spoken varieties including, beside Ijekavian, also Ikavian Shtokavian). Serbian is written in both Latin and Cyrillic, whereas Croatian and Bosnian are written only in Latin alphabet. There are also some speakers of Italian, German, Turkish and Ladino. Yugoslav Sign Language is used with Croatian and Serbian variants.
وحسب نتائج إحصاء 2013، 52.86% of the population consider their mother tongue to be Bosnian, 30.76% Serbian, 14.6% Croatian and 1.57% another language, with 0.21% not giving an answer.[4]
Linguistic structure of Bosnia and Herzegovina by municipalities in 2013
Linguistic structure of Bosnia and Herzegovina by municipalities in 2013
Share of the Bosnian language in Bosnia and Herzegovina by municipalities in 2013
Share of the Serbian language in Bosnia and Herzegovina by municipalities in 2013
Share of the Croatian language in Bosnia and Herzegovina by municipalities in 2013


الأديان
According to the 2013 census, 50.7% of the population identify religiously as Muslim, 30.75% as Serbian Orthodox Christian, 15.19% as Roman Catholic, 1.15% as other, 1.1% as agnostic or atheist, with the remainder not declaring their religion or not answering.[4] A 2012 survey found that 54% of Bosnia's Muslims are non-denominational Muslims, while 38% follow Sunnism.[13] In Bosnia and Herzegovina religion is strongly linked to ethnicity.
Religious structure of Bosnia and Herzegovina in 1879
Religious structure of Bosnia and Herzegovina by municipalities in 2013
Religious structure of Bosnia and Herzegovina by municipalities in 2013
Share of Muslims in Bosnia and Herzegovina by municipalities in 2013

Share of Orthodox Christians in Bosnia and Herzegovina by municipalities in 2013
Share of Catholics in Bosnia and Herzegovina by municipalities in 2013


إحصائيات ديمغرافية
The following demographic statistics are from the CIA World Factbook, unless otherwise indicated.
التعداد
- 3,871,643 (تقدير يوليو 2014)
التوزيع العمري
- 0-14 سنة: 13.7% (ذكور 272,812/إناث 256,152)
- 15-24 سنة: 12.7% (ذكور 255,074/إناث 238,428)
- 25-54 سنة: 46.7% (ذكور 906,265/إناث 899,870)
- 55-64 سنة: 13.7% (ذكور 253,045/إناث 276,769)
- 65 سنة وأعلى: 13.3% (ذكور 199,515/إناث 313,713) (تقدير 2014)
العمر الأوسط
- الإجمالي: 40.8 سنة
- الذكور: 39.4 سنة
- الإناث: 42.2 سنة (تقدير 2014)
نسبة الجنسين
- لدى الميلاد: 1.07 ذكر/أنثى
- 0-14 سنة: 1.07 ذكر/أنثى
- 15-24 سنة: 1.07 ذكر/أنثى
- 25-54 سنة: 1.01 ذكر/أنثى
- 55-64 سنة: 0.95 ذكر/أنثى
- 65 سنة وأعلى: 0.63 ذكر/أنثى
- إجمالي التعداد: 0.95 ذكر/أنثى (تقدير 2014)
. . . . . . . . . . . . . . . . . . . . . . . . . . . . . . . . . . . . . . . . . . . . . . . . . . . . . . . . . . . . . . . . . . . . . . . . . . . . . . . . . . . . . . . . . . . . . . . . . . . . . . . . . . . . . . . . . . . . . . . . . . . . . . . . . . . . . . . . . . . . . . . . . . . . . . . . . . . . . . . . . . . . . . . .
معدل وفيات الرضع
- الإجمالي: 5.84 وفاة/1,000 وليد حي
- الذكور: 5.91 deaths/1,000 live births
- الإناث: 5.78 deaths/1,000 live births (2014 est.)
العمر المتوقع لدى الولادة
- Total population: 76.33 years
- الذكور: 73.33 سنة
- الإناث: 79.55 سنة (تقدير 2014)
الإيدز
- المعدل الغالب في البالغين: أقل من 0.1% (تقدير 2007)
- People living with HIV/AIDS: 900 (2007 est.)
- الوفيات: 100 (تقدير 2001)
القراءة والكتابة
- التعريف: عمر 15 وأعلى بإمكانه القراءة والكتابة
- إجمالي العدد: 98%
- الذكور: 99.5%
- الإناث: 96.7% (تقدير 2011)
انظر أيضاً
- Demographic history of Bosnia and Herzegovina
- Bosnia and Herzegovina
- List of Bosnians and Herzegovinians
الأديان:
- Islam in Bosnia and Herzegovina
- Serbian Orthodox Church
- Roman Catholicism in Bosnia and Herzegovina
- Jews in Bosnia and Herzegovina
الجماعات:
الهامش
- ^ Institut national d'études démographique (INED)
- ^ Agency for Statistics Bosnia and Herzegovina
- ^ http://www.bhas.ba/tematskibilteni/BHAS_Demografija_BH.pdf
- ^ أ ب ت "Census of population, households and dwellings in Bosnia and Herzegovina, 2013: Final results" (PDF). Agency for Statistics of Bosnia and Herzegovina. June 2016. Retrieved 1 July 2016.
- ^ Toe, Rodolfo (30 June 2016). "Census Reveals Bosnia's Changed Demography". Balkan Insight. Retrieved 1 July 2016.
- ^ Toe, Rodolfo (30 June 2016). "Bosnia to Publish Census Without Serb Agreement". Balkan Insight. Retrieved 1 July 2016.
- ^ "Bosnia-Herzegovina has lost a fifth of its pre-war population". The Guardian. 2016.
- ^ Faingold, Eduardo D. (2004). "Language rights and language justice in the constitutions of the world". Language Problems & Language Planning. 28 (1): 11–24. doi:10.1075/lplp.28.1.03fai.
- ^ Sadurski, Wojciech (2005). Rights Before Courts: A Study of Constitutional Courts in Postcommunist States of Central and Eastern Europe. Springer. p. 342. ISBN 1402030061.
- ^ أ ب ت Footitt, Hilary; Kelly, Michael (2012). Languages at War: Policies and Practices of Language Contacts in Conflict. Basingstoke: Palgrave Macmillan. pp. 111–120. ISBN 0230368778.
- ^ Greenberg, Robert David (2004). Language and Identity in the Balkans: Serbo-Croatian and its Disintegration. Oxford: Oxford University Press. ISBN 978-0-19-925815-4.
- ^ Kelly, Michael; Baker, Catherine (2013). Interpreting the Peace: Peace Operations, Conflict and Language in Bosnia-Herzegovina. Basingstoke: Palgrave Macmillan. p. 10. ISBN 1137029838.
- ^ "The World's Muslims: Unity and Diversity" (PDF). Pew Research Center. 2012. p. 30. Retrieved 7 April 2016.
![]() This article contains material from the CIA World Factbook (2009 edition) which, as a U.S. government publication, is in the المشاع.
This article contains material from the CIA World Factbook (2009 edition) which, as a U.S. government publication, is in the المشاع.
وصلات خارجية
موضوعات عن | |
|---|---|
| التاريخ | |
| الجغرافيا | |
| الحوكمة | |
| الاقتصاد | |
| المجتمع | |
| الثقافة | |